NFLX Trading Predictions
1 Day Prediction
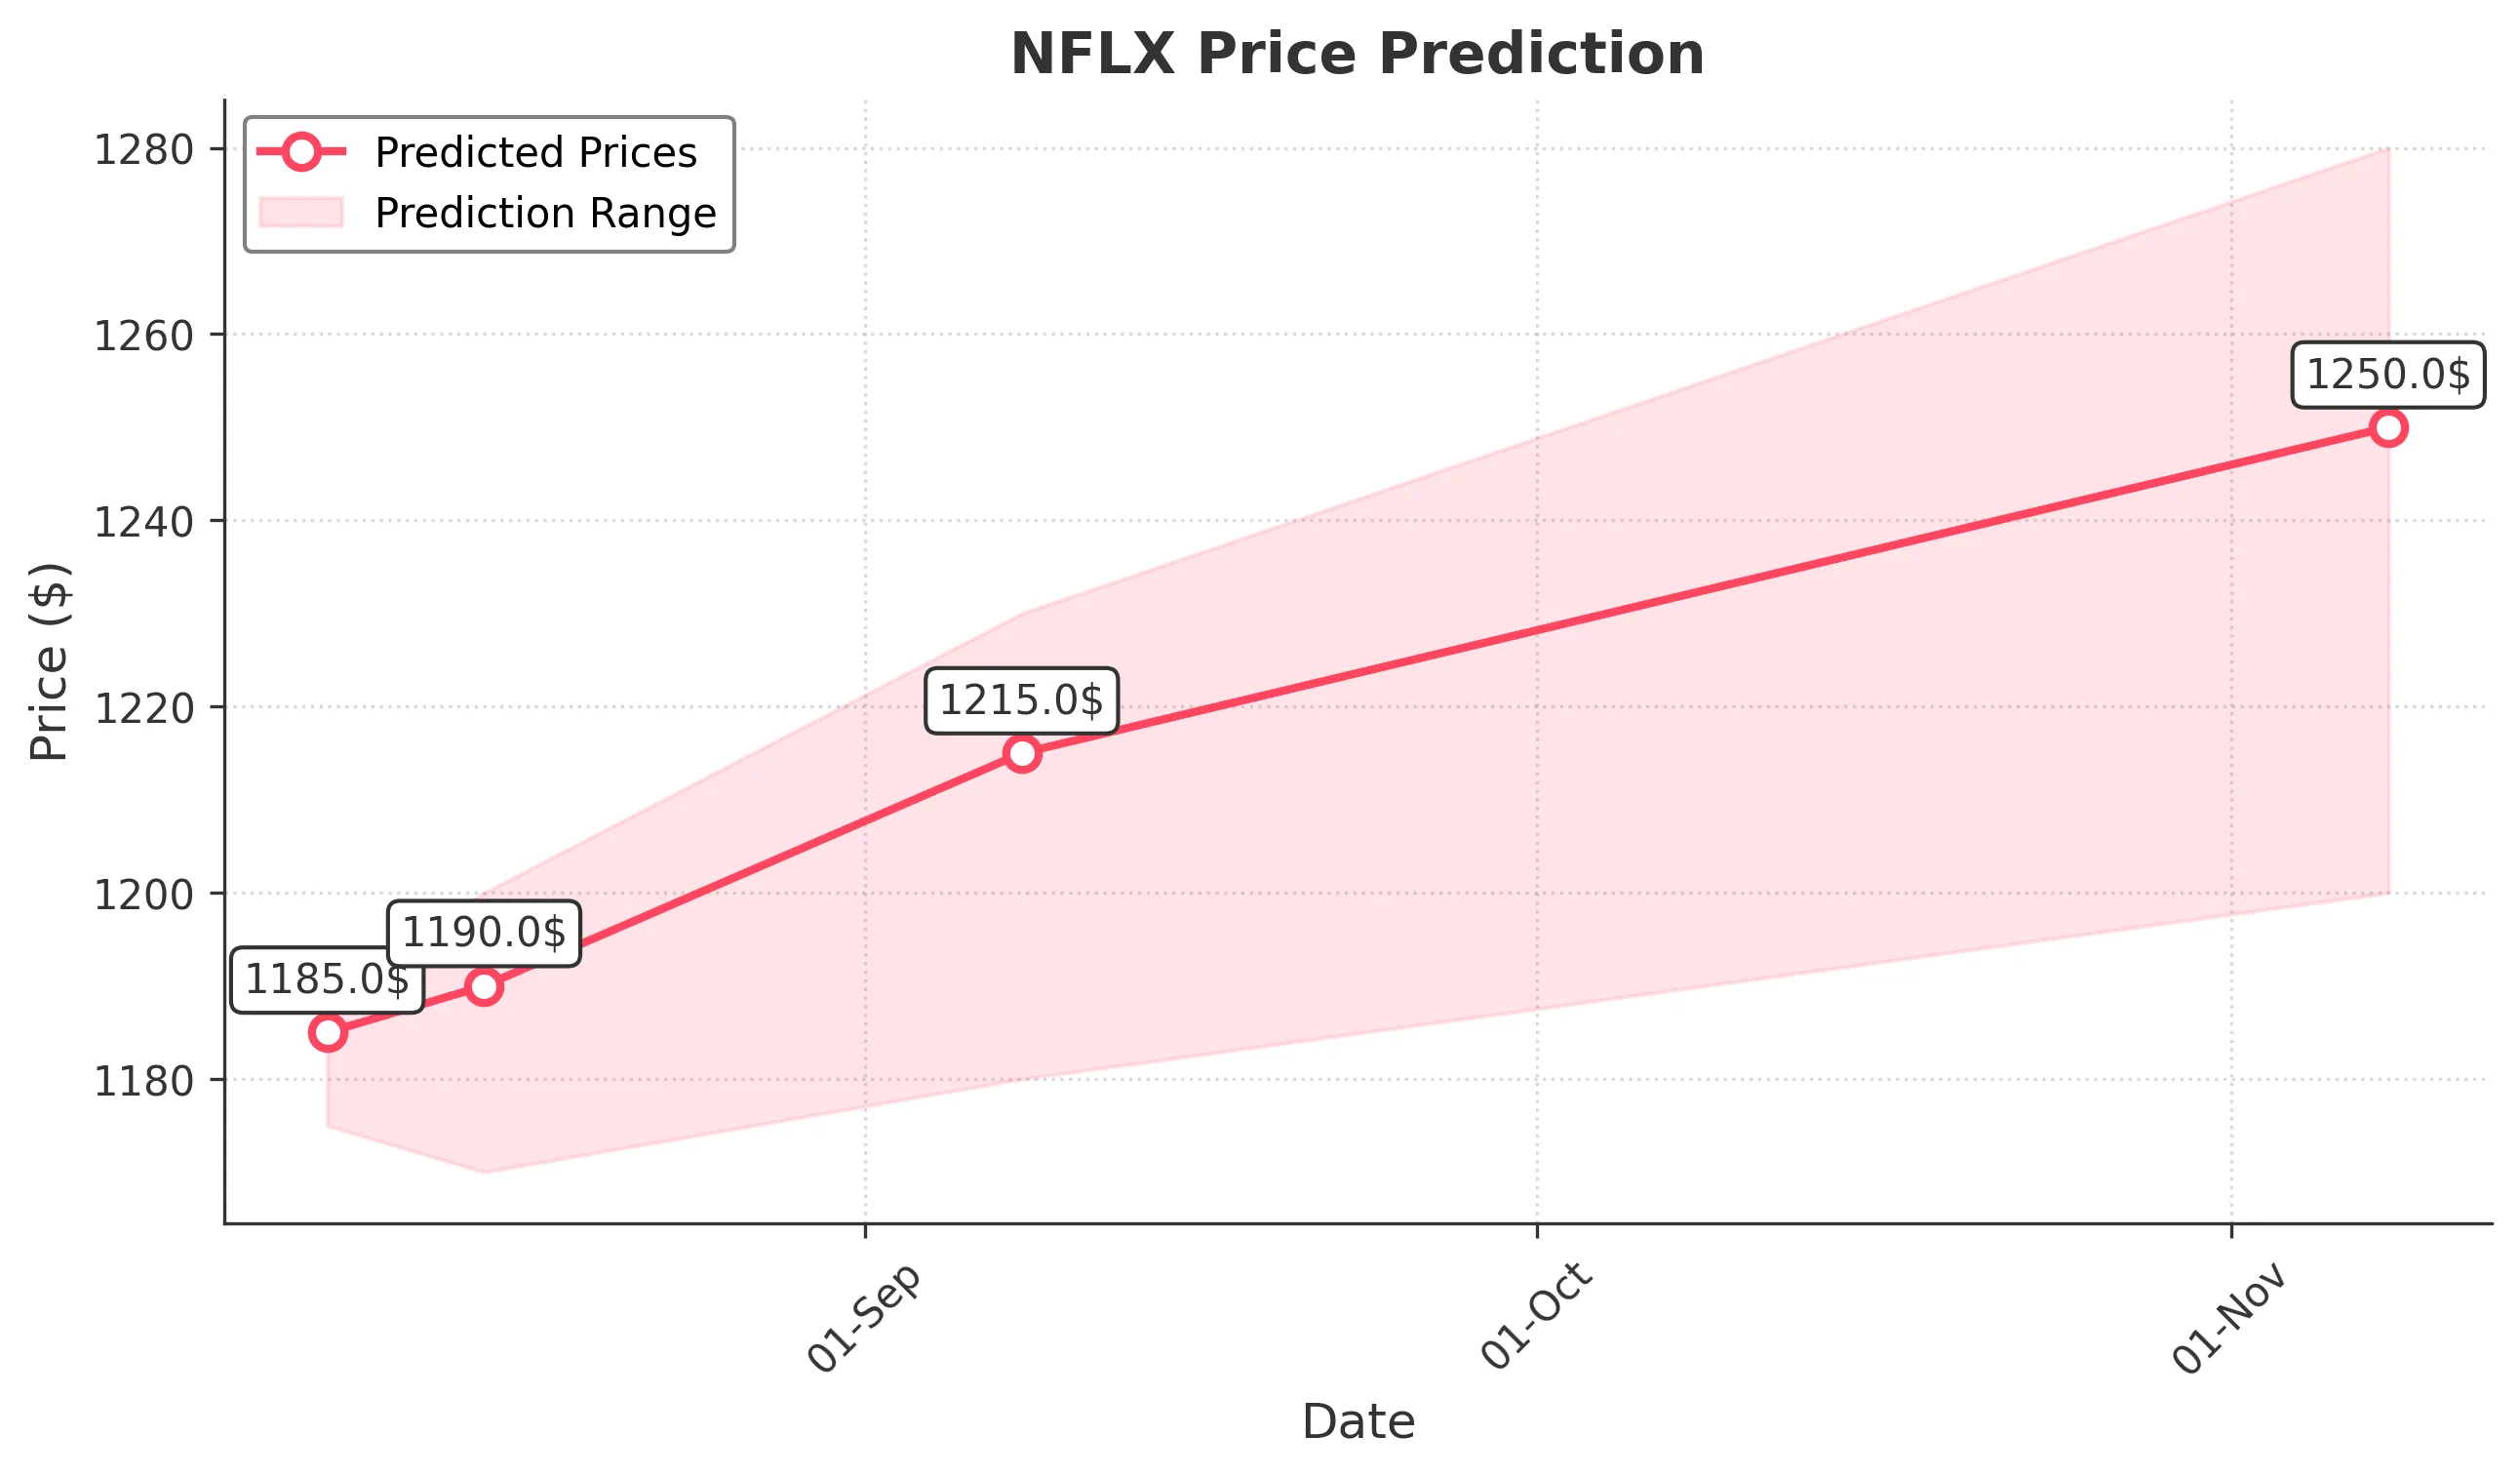
Target: August 8, 2025$1185
$1180
$1190
$1175
Description
The stock shows a slight bullish trend with a recent Doji candlestick indicating indecision. RSI is neutral, and MACD is close to crossing above the signal line, suggesting potential upward momentum. However, recent volatility may limit gains.
Analysis
Over the past 3 months, NFLX has shown a bearish trend with significant fluctuations. Key support is around $1150, while resistance is near $1200. The RSI indicates neutral momentum, and volume spikes were noted during sell-offs, suggesting caution.
Confidence Level
Potential Risks
Market sentiment could shift due to external news or earnings reports, which may impact the stock's performance.
1 Week Prediction
Target: August 15, 2025$1190
$1185
$1200
$1170
Description
A potential recovery is indicated as the stock approaches a Fibonacci retracement level. The MACD shows bullish divergence, and the recent candlestick patterns suggest a reversal. However, market volatility remains a concern.
Analysis
The stock has been in a bearish phase, with significant resistance at $1200. Recent volume patterns indicate selling pressure, but a potential reversal is forming. The ATR suggests increased volatility, warranting caution.
Confidence Level
Potential Risks
Unforeseen macroeconomic events or earnings surprises could lead to increased volatility, impacting the prediction.
1 Month Prediction
Target: September 8, 2025$1215
$1195
$1230
$1180
Description
The stock may stabilize as it approaches key support levels. The RSI is expected to trend upwards, and the MACD may confirm a bullish crossover. However, external market factors could introduce volatility.
Analysis
NFLX has shown mixed signals over the past months, with key support at $1150 and resistance at $1230. The stock's performance has been influenced by broader market trends and earnings reports, leading to uncertainty.
Confidence Level
Potential Risks
Market sentiment can shift rapidly, and any negative news could reverse the expected trend.
3 Months Prediction
Target: November 8, 2025$1250
$1220
$1280
$1200
Description
If the bullish trend continues, the stock could reach $1250, supported by positive earnings and market sentiment. However, resistance at $1280 may limit gains. Watch for potential bearish reversals.
Analysis
The stock has been volatile, with a bearish trend recently. Key resistance levels are at $1280, while support is around $1200. The overall market sentiment and macroeconomic conditions will play a crucial role in future performance.
Confidence Level
Potential Risks
Long-term predictions are uncertain due to potential market corrections and economic factors that could impact performance.