NSDQ Trading Predictions
1 Day Prediction
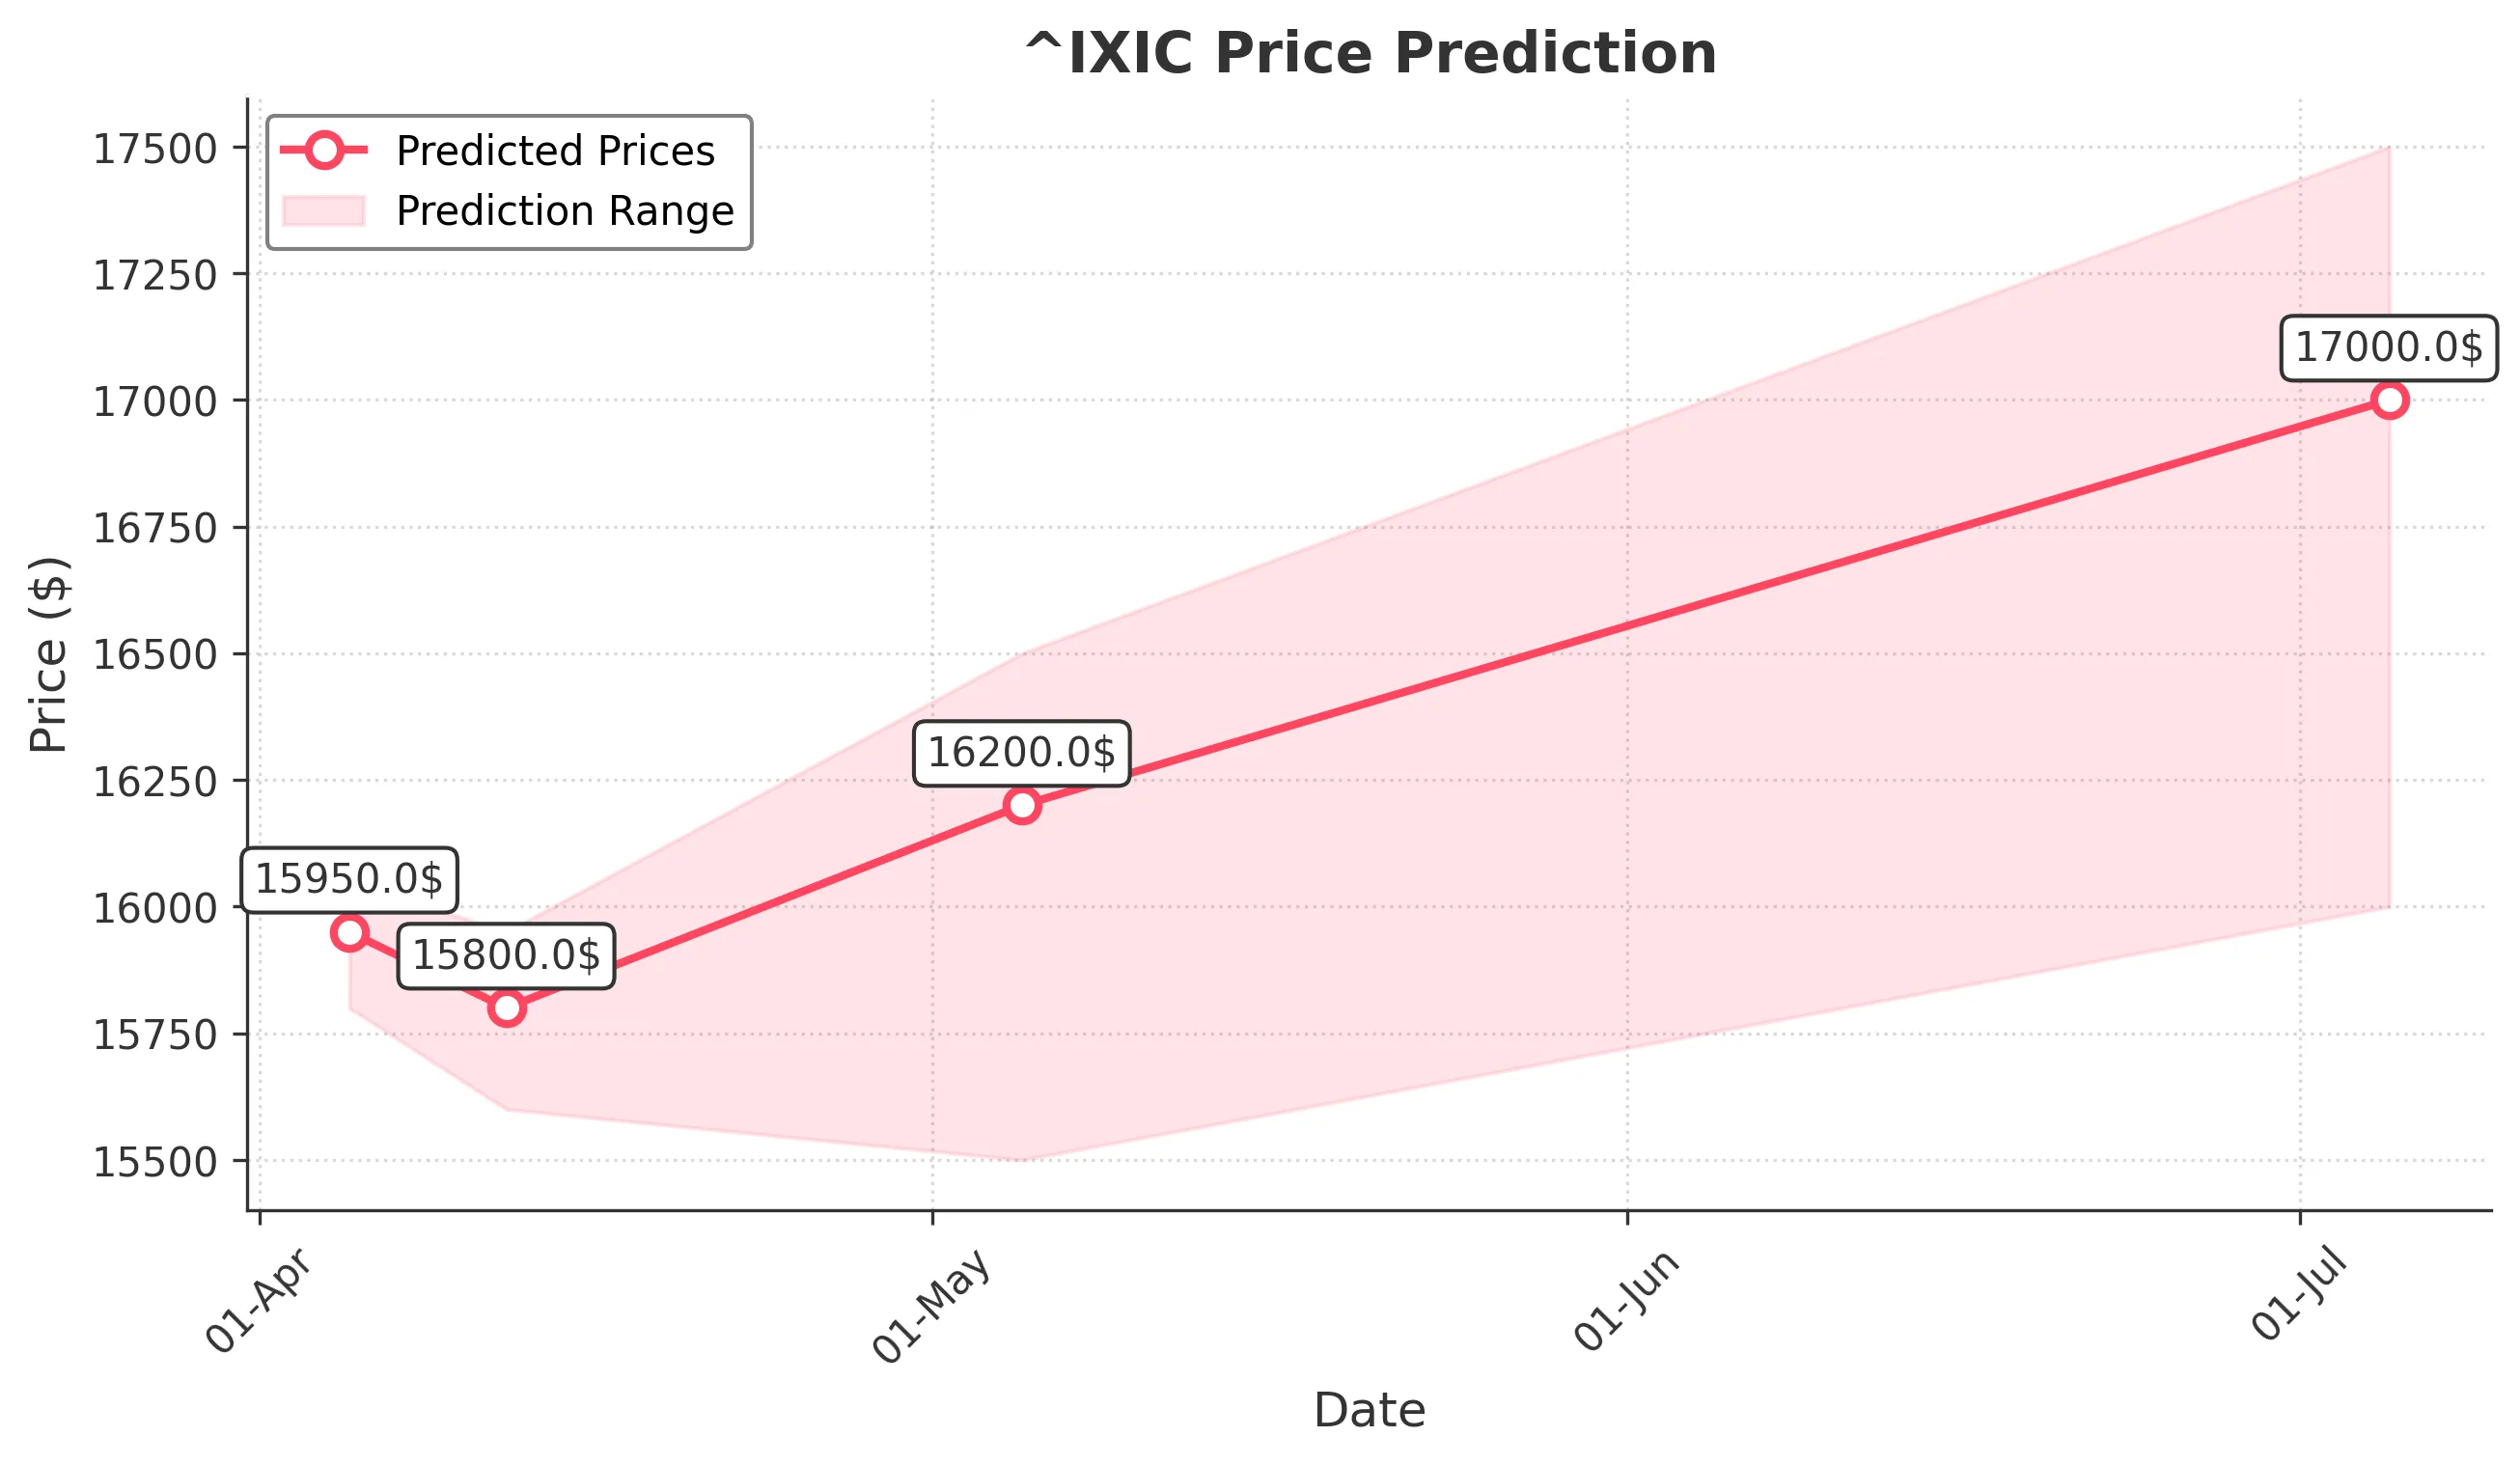
Target: April 5, 2025$15950
$15980
$16050
$15800
Description
The market shows bearish momentum with a recent downtrend. The RSI indicates oversold conditions, but the MACD is bearish. A potential bounce could occur, but overall sentiment remains negative due to recent volatility.
Analysis
The past 3 months show a bearish trend with significant resistance around 18000. The recent drop below 17000 indicates weakness. Volume spikes during declines suggest selling pressure. The ATR indicates high volatility, and macroeconomic factors remain uncertain.
Confidence Level
Potential Risks
Market volatility and external news could impact the prediction. A sudden positive catalyst could reverse the trend.
1 Week Prediction
Target: April 12, 2025$15800
$15850
$15950
$15600
Description
Bearish sentiment persists with continued selling pressure. The Bollinger Bands indicate a squeeze, suggesting potential volatility. The MACD remains negative, and the RSI is approaching oversold levels, indicating a possible short-term bounce.
Analysis
The stock has been in a downtrend, with key support at 15600. The recent price action shows a lack of buying interest. Volume analysis indicates increased selling, and the overall market sentiment is cautious.
Confidence Level
Potential Risks
Unforeseen macroeconomic events or earnings reports could lead to unexpected price movements.
1 Month Prediction
Target: May 5, 2025$16200
$16000
$16500
$15500
Description
A potential recovery could occur as the market may find support around 15600. The RSI may rebound from oversold levels, and if bullish sentiment returns, we could see a gradual increase in price.
Analysis
The stock has shown significant volatility with a bearish trend. Key support at 15600 is critical. The MACD indicates potential for a reversal, but overall market sentiment remains cautious. Volume patterns suggest a lack of strong buying interest.
Confidence Level
Potential Risks
The bearish trend could continue if economic conditions worsen or if there are negative earnings surprises.
3 Months Prediction
Target: July 5, 2025$17000
$16800
$17500
$16000
Description
If the market stabilizes and economic conditions improve, we could see a gradual recovery towards 17000. The RSI may normalize, and if bullish momentum builds, we could see a test of resistance levels.
Analysis
The stock has been in a bearish phase, with significant resistance at 18000. The potential for recovery exists if market sentiment shifts positively. However, the overall trend remains uncertain, and external factors could heavily influence price movements.
Confidence Level
Potential Risks
Economic uncertainties and potential geopolitical events could derail recovery efforts.