NSDQ Trading Predictions
1 Day Prediction
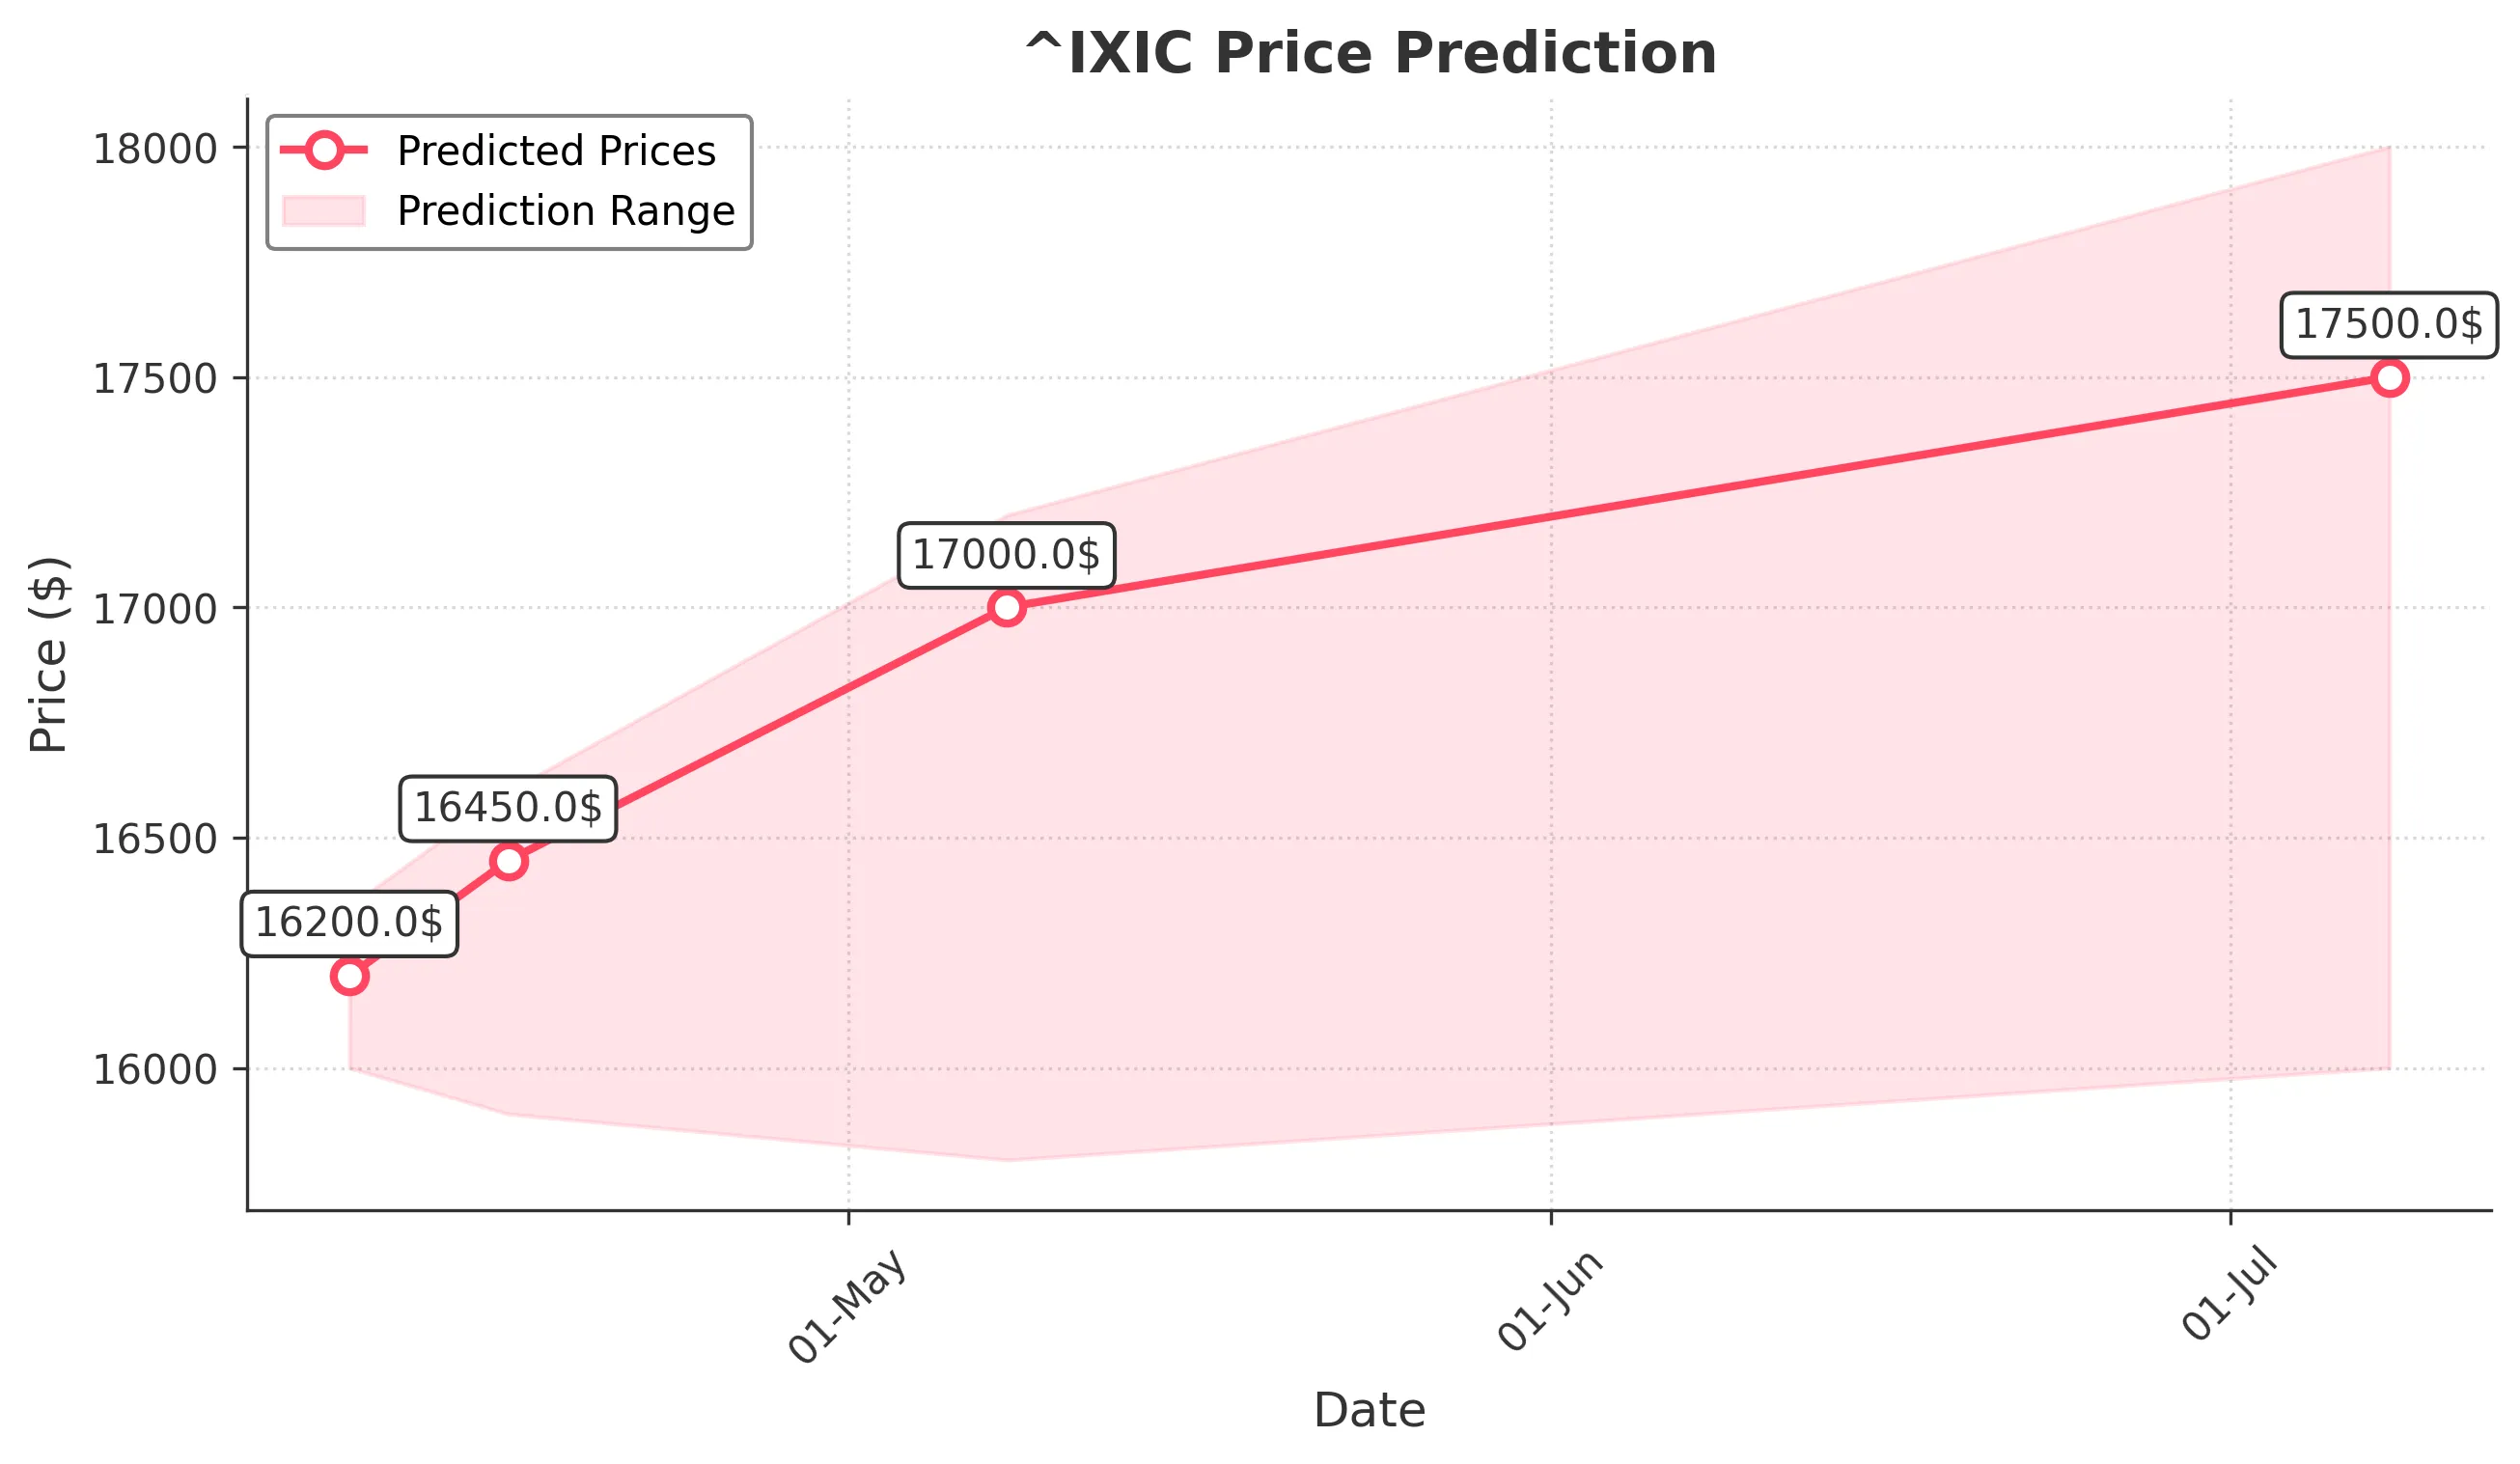
Target: April 9, 2025$16200
$16150
$16350
$16000
Description
The market shows signs of recovery after recent declines, with a potential bounce off support around 16000. RSI indicates oversold conditions, suggesting a short-term bullish reversal. However, volatility remains high, warranting caution.
Analysis
The past three months have seen a bearish trend, with significant drops in price and high volatility. Key support at 16000 has held, but resistance remains strong around 17000. Volume spikes indicate potential reversals, but overall sentiment is cautious.
Confidence Level
Potential Risks
Market sentiment is fragile, and any negative news could reverse this trend quickly.
1 Week Prediction
Target: April 16, 2025$16450
$16250
$16600
$15900
Description
A slight upward trend is expected as the market stabilizes. The MACD shows a bullish crossover, and the RSI is recovering from oversold levels. However, resistance at 17000 may limit gains.
Analysis
The index has faced significant selling pressure, with key support levels being tested. Technical indicators suggest a possible short-term recovery, but the overall bearish sentiment remains a concern. Volume analysis shows increased activity during sell-offs.
Confidence Level
Potential Risks
Potential for further economic data releases could impact market direction unexpectedly.
1 Month Prediction
Target: May 8, 2025$17000
$16500
$17200
$15800
Description
Expect a gradual recovery as the market digests recent losses. Fibonacci retracement levels suggest potential resistance at 17000, but bullish momentum may build if economic indicators improve.
Analysis
The index has been in a bearish phase, with significant volatility and volume spikes. Key support at 16000 has been tested multiple times. Technical indicators show mixed signals, indicating uncertainty in market direction.
Confidence Level
Potential Risks
Economic uncertainties and geopolitical tensions could derail recovery efforts.
3 Months Prediction
Target: July 8, 2025$17500
$17200
$18000
$16000
Description
A potential recovery trend may emerge if economic conditions stabilize. However, resistance at 18000 could pose challenges. Market sentiment remains cautious, influenced by macroeconomic factors.
Analysis
The index has experienced significant fluctuations, with a bearish trend dominating the last three months. Key resistance levels are evident, and while there are signs of recovery, external factors could heavily influence future performance.
Confidence Level
Potential Risks
Long-term predictions are uncertain due to potential economic downturns and market volatility.