NSDQ Trading Predictions
1 Day Prediction
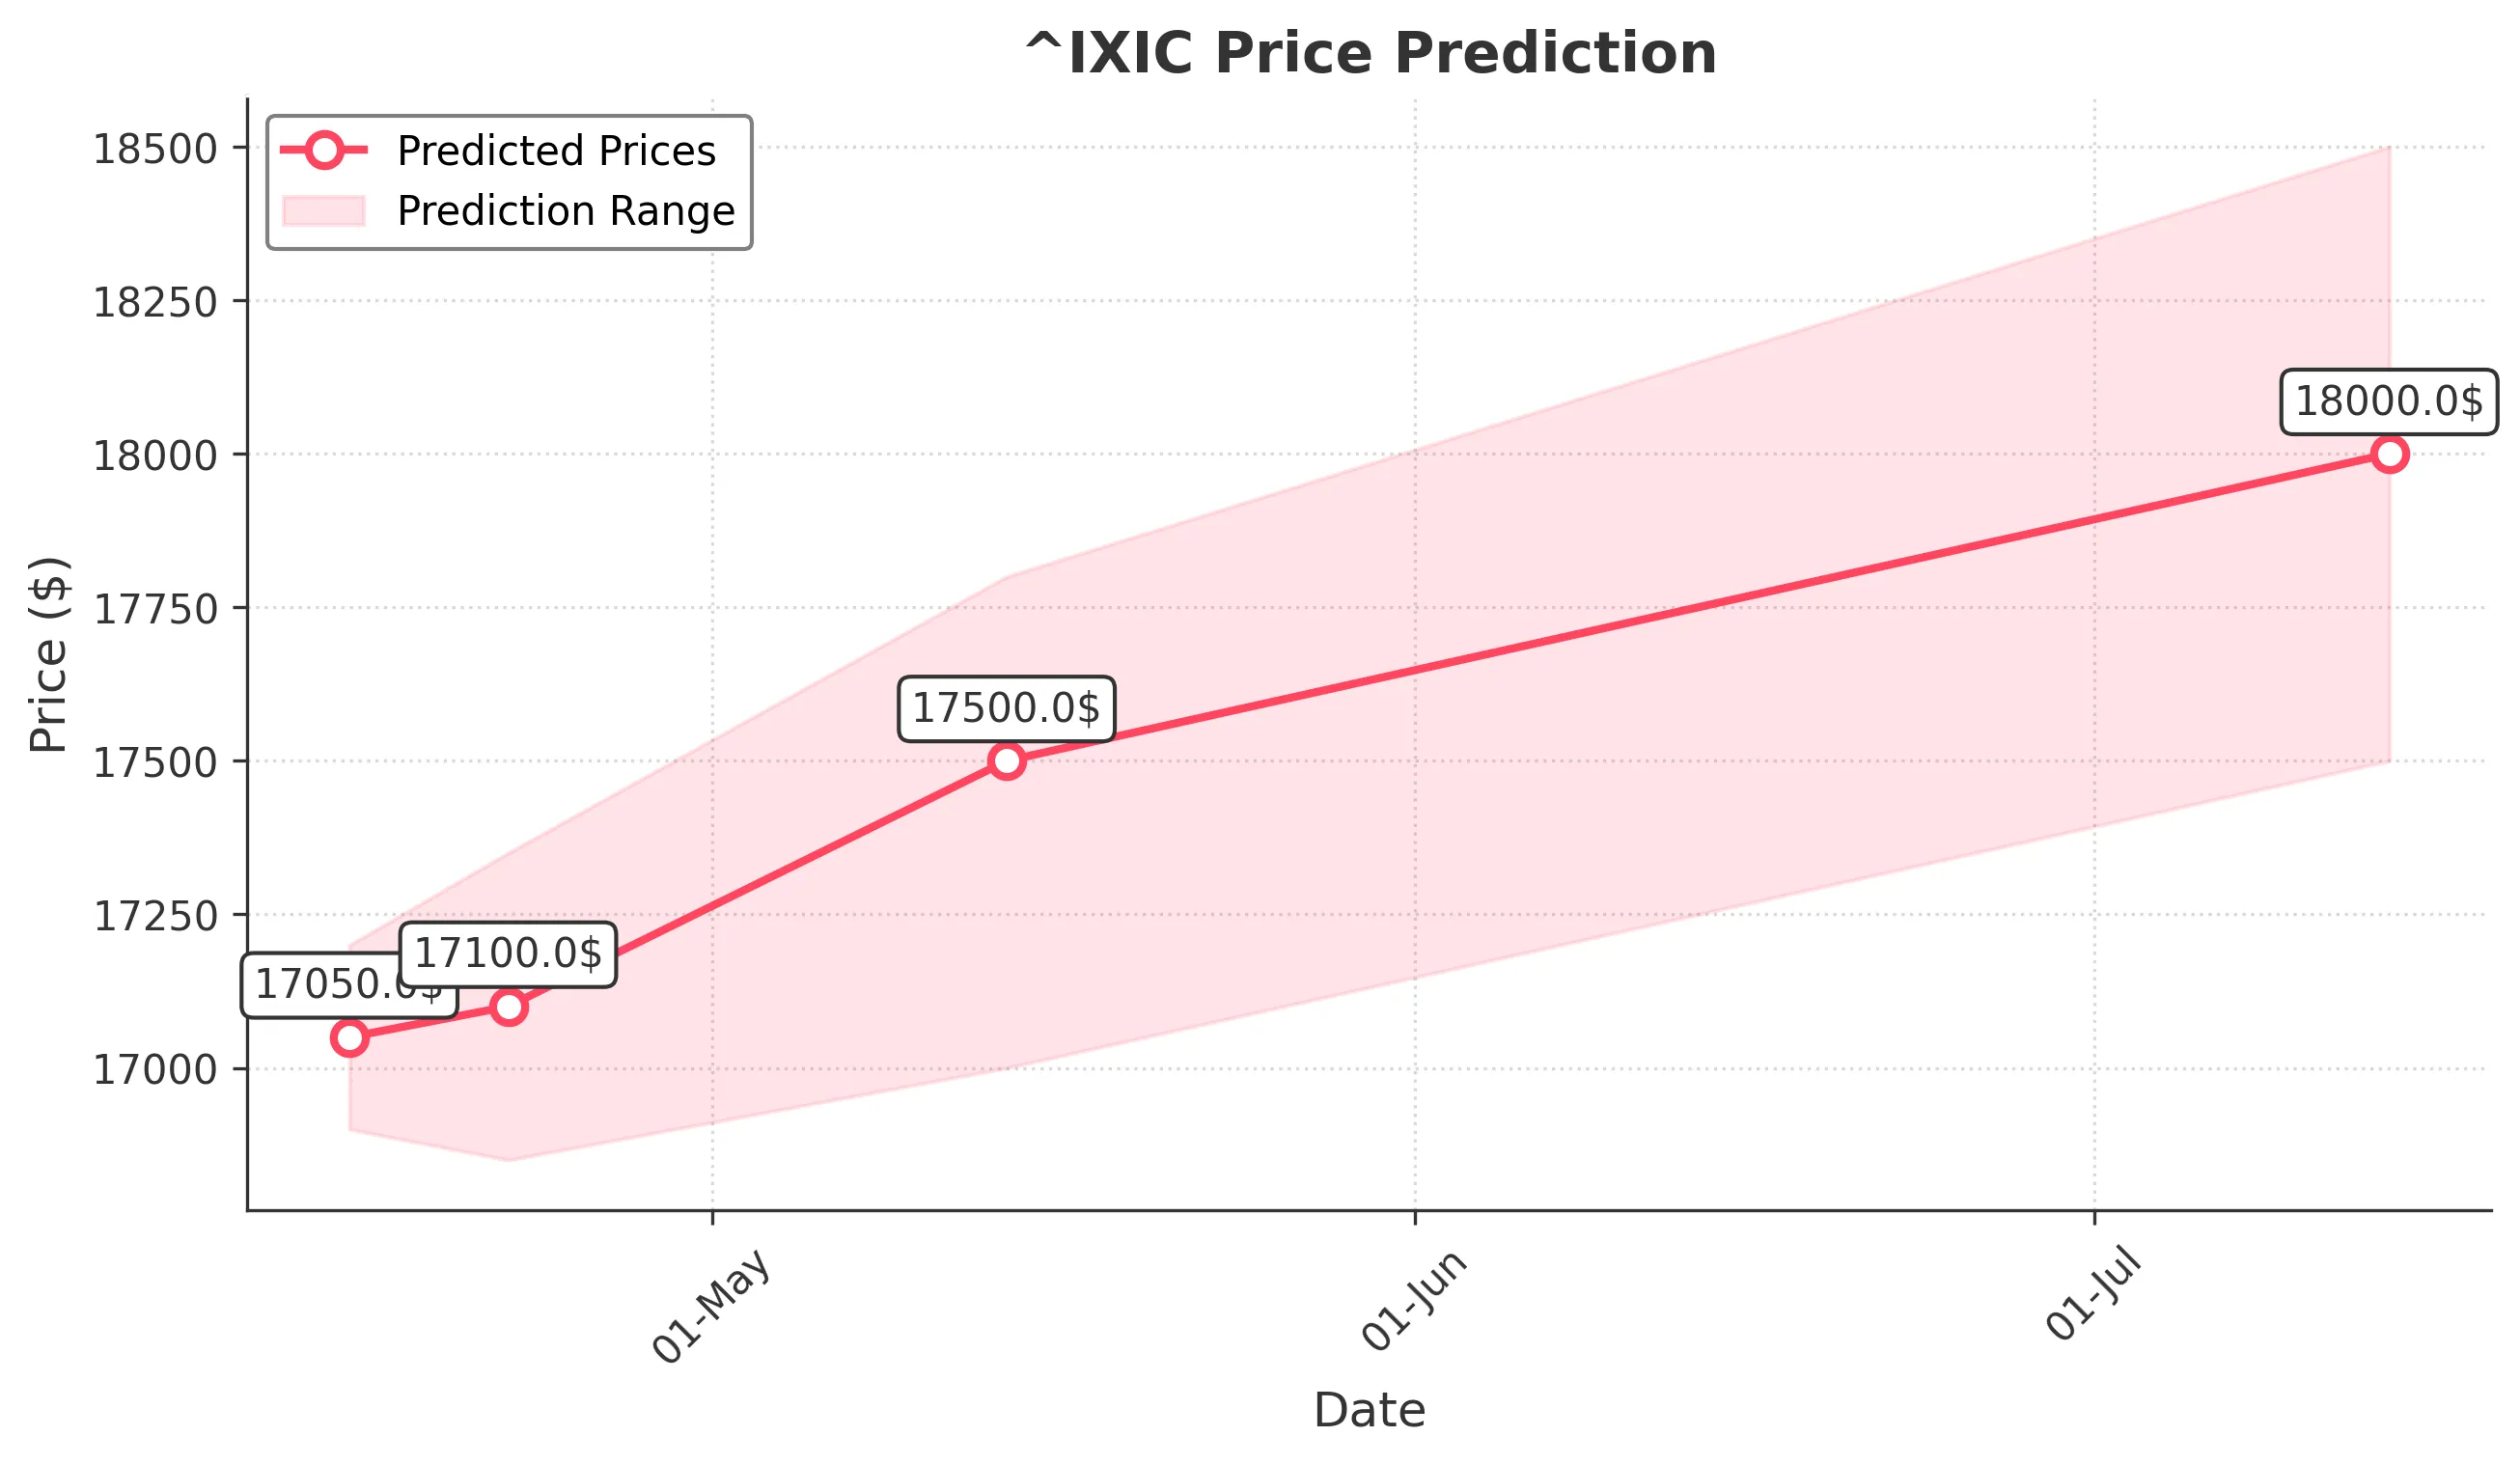
Target: April 15, 2025$17050
$17020
$17200
$16900
Description
The market shows signs of stabilization after recent volatility. The RSI is neutral, and MACD indicates a potential bullish crossover. However, recent high volume suggests caution. Expect a slight upward movement.
Analysis
The past 3 months have seen significant volatility, with a bearish trend recently. Key support at 17000 and resistance at 17500. Volume spikes indicate potential reversals, while the ATR suggests increased volatility.
Confidence Level
Potential Risks
Market sentiment could shift due to external news or economic data releases, which may impact the prediction.
1 Week Prediction
Target: April 22, 2025$17100
$17080
$17350
$16850
Description
Expect a slight recovery as the market digests recent losses. The Bollinger Bands indicate potential upward movement, but caution is warranted due to recent bearish patterns. Volume may remain elevated.
Analysis
The market has been bearish, with significant sell-offs. Key support at 17000 is critical. Technical indicators show mixed signals, with some suggesting a potential bounce, but overall sentiment remains cautious.
Confidence Level
Potential Risks
Potential for further downside if macroeconomic indicators disappoint or if geopolitical tensions escalate.
1 Month Prediction
Target: May 14, 2025$17500
$17450
$17800
$17000
Description
A gradual recovery is anticipated as the market stabilizes. The MACD shows signs of bullish momentum, and RSI is approaching oversold territory. However, external factors could still impact this trend.
Analysis
The market has been volatile, with a bearish trend recently. Key resistance at 17500 and support at 17000. Technical indicators suggest a potential recovery, but external factors remain a concern.
Confidence Level
Potential Risks
Economic data releases and earnings reports could lead to volatility, affecting the predicted upward trend.
3 Months Prediction
Target: July 14, 2025$18000
$17900
$18500
$17500
Description
Long-term recovery expected as market sentiment improves. Technical indicators suggest a bullish trend, but macroeconomic conditions will play a crucial role in sustaining this momentum.
Analysis
The market has shown signs of recovery potential, but the past three months have been marked by significant volatility. Key resistance at 18500 and support at 17500. Technical indicators suggest a cautious bullish outlook.
Confidence Level
Potential Risks
Unforeseen economic events or geopolitical tensions could derail the recovery, leading to increased volatility.