NSDQ Trading Predictions
1 Day Prediction
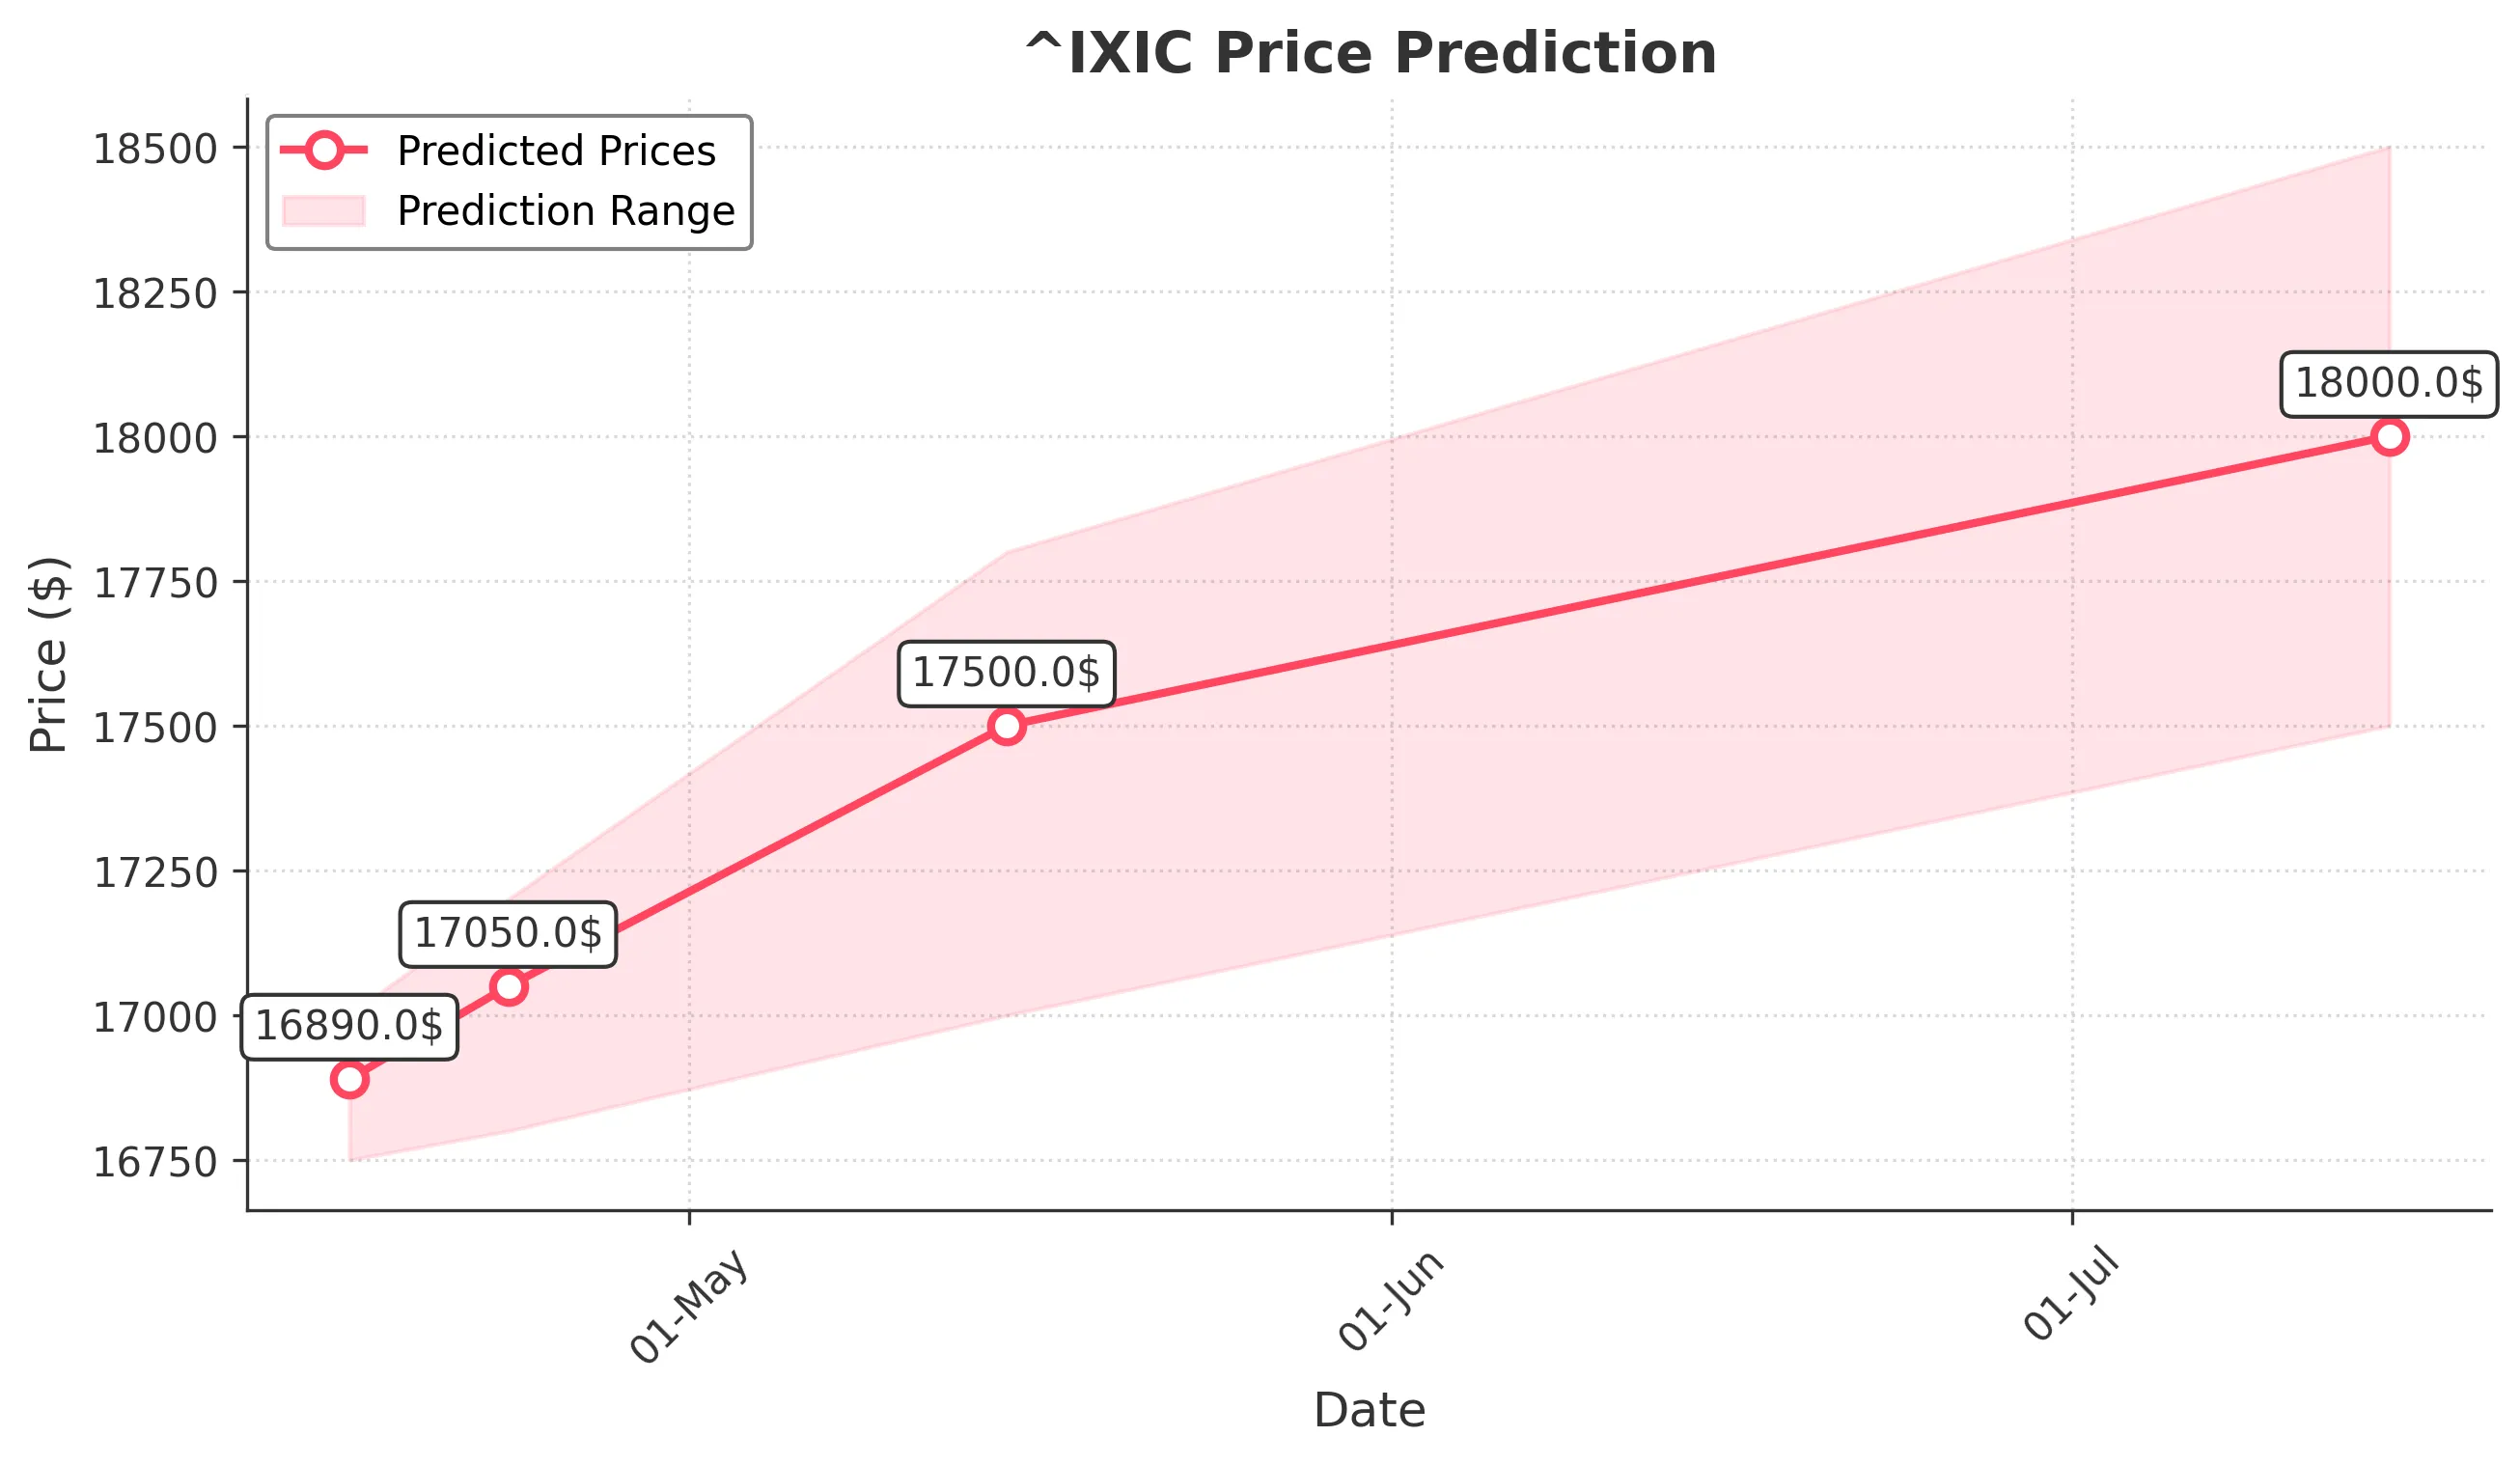
Target: April 16, 2025$16890
$16860
$17000
$16750
Description
The market shows signs of stabilization after recent volatility. The RSI is neutral, and MACD indicates a potential bullish crossover. However, recent high volume suggests caution. Expect a slight upward movement.
Analysis
The past 3 months have seen significant volatility, with a bearish trend recently. Key support at 16500 and resistance at 17000. Volume spikes indicate potential reversals, while the RSI suggests indecision. Overall, a cautious bullish outlook.
Confidence Level
Potential Risks
Market sentiment remains fragile, and any negative news could reverse the trend.
1 Week Prediction
Target: April 23, 2025$17050
$16900
$17200
$16800
Description
A potential recovery is indicated as the market stabilizes. The MACD shows bullish momentum, and the RSI is improving. However, resistance at 17200 may limit gains. Watch for volume trends.
Analysis
The market has been bearish recently, but signs of recovery are emerging. Key support at 16500 and resistance at 17200. Volume analysis shows increased activity, suggesting traders are positioning for a potential rebound.
Confidence Level
Potential Risks
Economic data releases could impact market sentiment, leading to unexpected volatility.
1 Month Prediction
Target: May 15, 2025$17500
$17150
$17800
$17000
Description
If the bullish trend continues, we could see a gradual rise towards 17500. The MACD is bullish, and the RSI is trending upwards. However, external economic factors could pose risks.
Analysis
The market has shown a bearish trend recently, but potential recovery signals are present. Key resistance at 17800 and support at 17000. Volume patterns indicate traders are cautiously optimistic, but external factors remain a concern.
Confidence Level
Potential Risks
Unforeseen macroeconomic events could derail the recovery, leading to increased volatility.
3 Months Prediction
Target: July 15, 2025$18000
$17700
$18500
$17500
Description
If the current recovery trend holds, we could see the index approach 18000. The MACD and RSI suggest bullish momentum, but market sentiment remains sensitive to economic news.
Analysis
The market has been volatile, with a recent bearish trend. However, signs of recovery are emerging. Key resistance at 18500 and support at 17500. Volume analysis shows increased activity, indicating traders are positioning for potential gains.
Confidence Level
Potential Risks
Long-term predictions are uncertain due to potential economic downturns or geopolitical tensions.