NSDQ Trading Predictions
1 Day Prediction
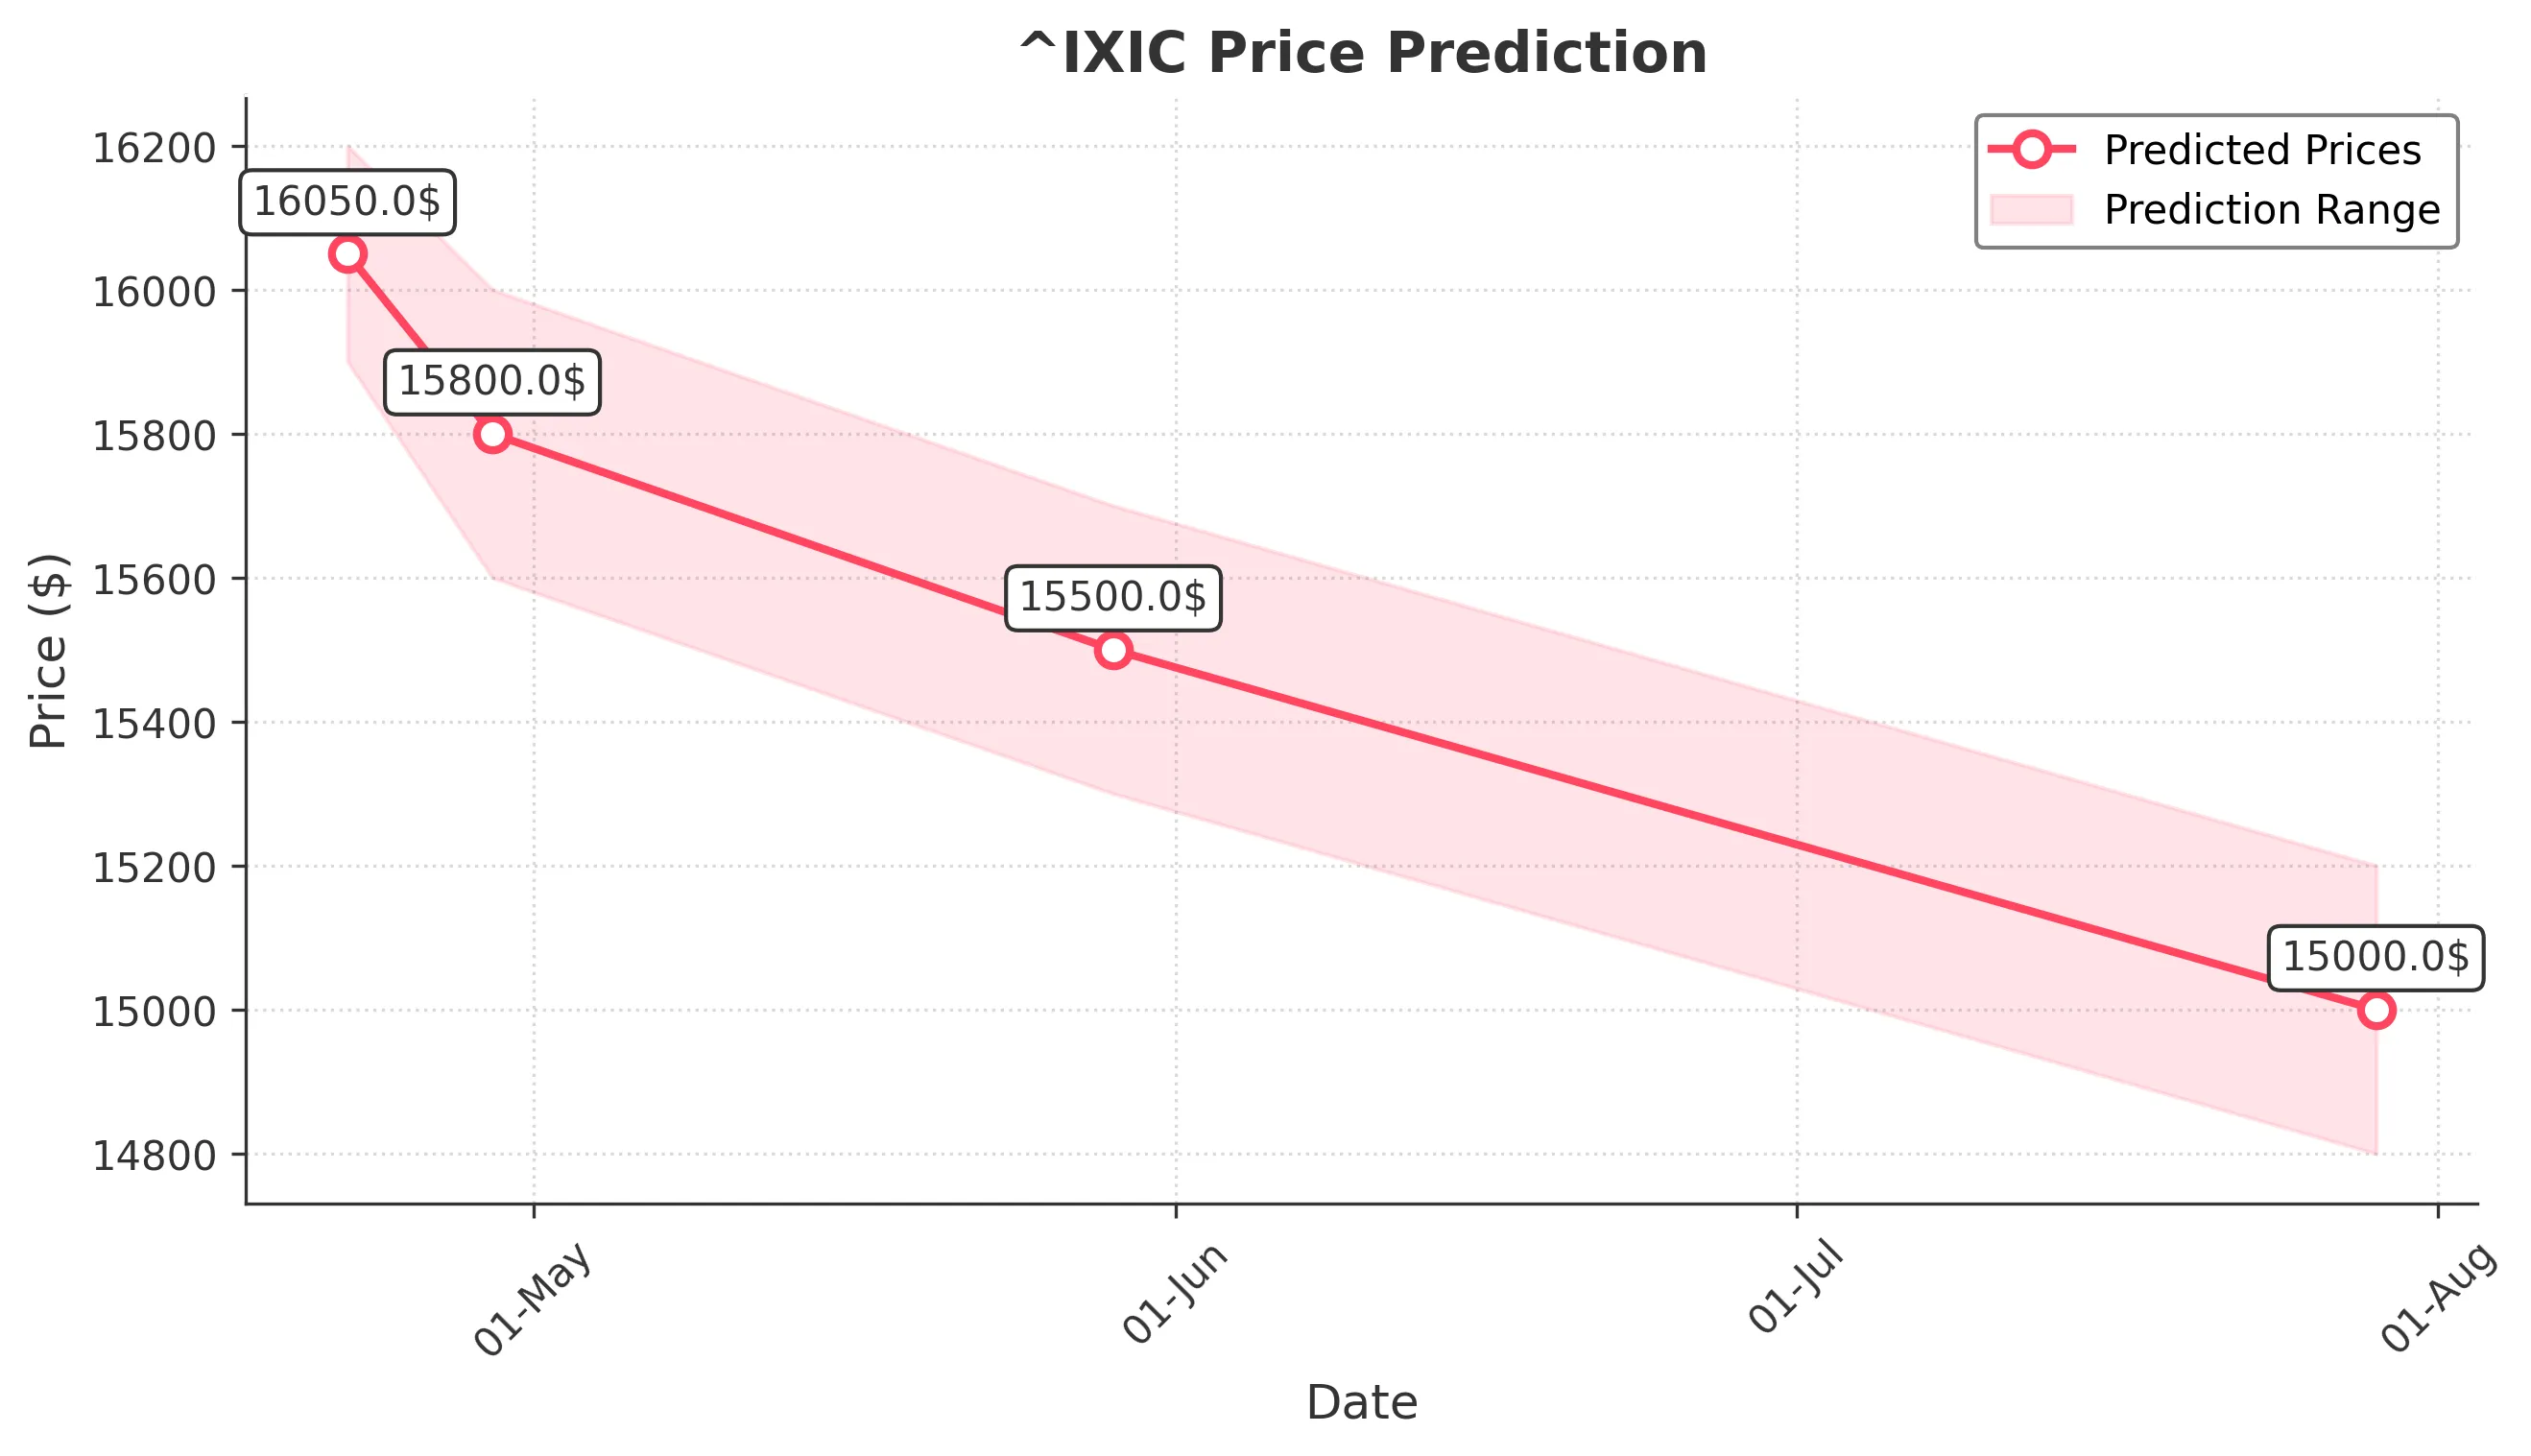
Target: April 22, 2025$16050
$16030
$16200
$15900
Description
The market shows bearish momentum with a recent downtrend. RSI indicates oversold conditions, but MACD suggests potential for a slight rebound. Volume remains high, indicating strong selling pressure. Expect a close around 16050.
Analysis
The past three months have shown a bearish trend with significant support around 16000. Technical indicators like moving averages and ATR suggest increased volatility. Volume spikes indicate strong selling pressure, while recent candlestick patterns show indecision.
Confidence Level
Potential Risks
Market volatility and potential news events could impact the prediction. A sudden bullish reversal is possible if sentiment shifts.
1 Week Prediction
Target: April 29, 2025$15800
$15900
$16000
$15600
Description
Bearish sentiment persists with potential for further declines. The market is testing support levels, and if broken, could lead to a close around 15800. Watch for volume spikes indicating panic selling.
Analysis
The stock has been in a downtrend, with key support at 16000. Technical indicators show bearish divergence, and volume analysis indicates strong selling. Candlestick patterns suggest indecision, but overall sentiment remains negative.
Confidence Level
Potential Risks
Unforeseen macroeconomic events or earnings reports could lead to volatility. A bullish reversal is possible if support holds.
1 Month Prediction
Target: May 29, 2025$15500
$15600
$15700
$15300
Description
Continued bearish pressure expected as the market struggles to find support. Technical indicators suggest further declines, with a potential close around 15500. Watch for any signs of reversal.
Analysis
The overall trend remains bearish, with significant resistance at 16000. Technical indicators like MACD and RSI suggest further downside potential. Volume patterns indicate strong selling, and candlestick formations show bearish sentiment.
Confidence Level
Potential Risks
Market sentiment can shift rapidly, and any positive news could lead to a reversal. The potential for a bounce exists if support levels are respected.
3 Months Prediction
Target: July 29, 2025$15000
$15100
$15200
$14800
Description
Long-term bearish outlook as the market continues to face downward pressure. Expect a close around 15000, with potential for further declines if support levels fail.
Analysis
The stock has been in a prolonged downtrend, with key support levels being tested. Technical indicators suggest a bearish outlook, and volume analysis shows persistent selling pressure. Candlestick patterns indicate a lack of buying interest.
Confidence Level
Potential Risks
Economic indicators and geopolitical events could significantly impact market direction. A bullish reversal is possible if sentiment shifts.