NSDQ Trading Predictions
1 Day Prediction
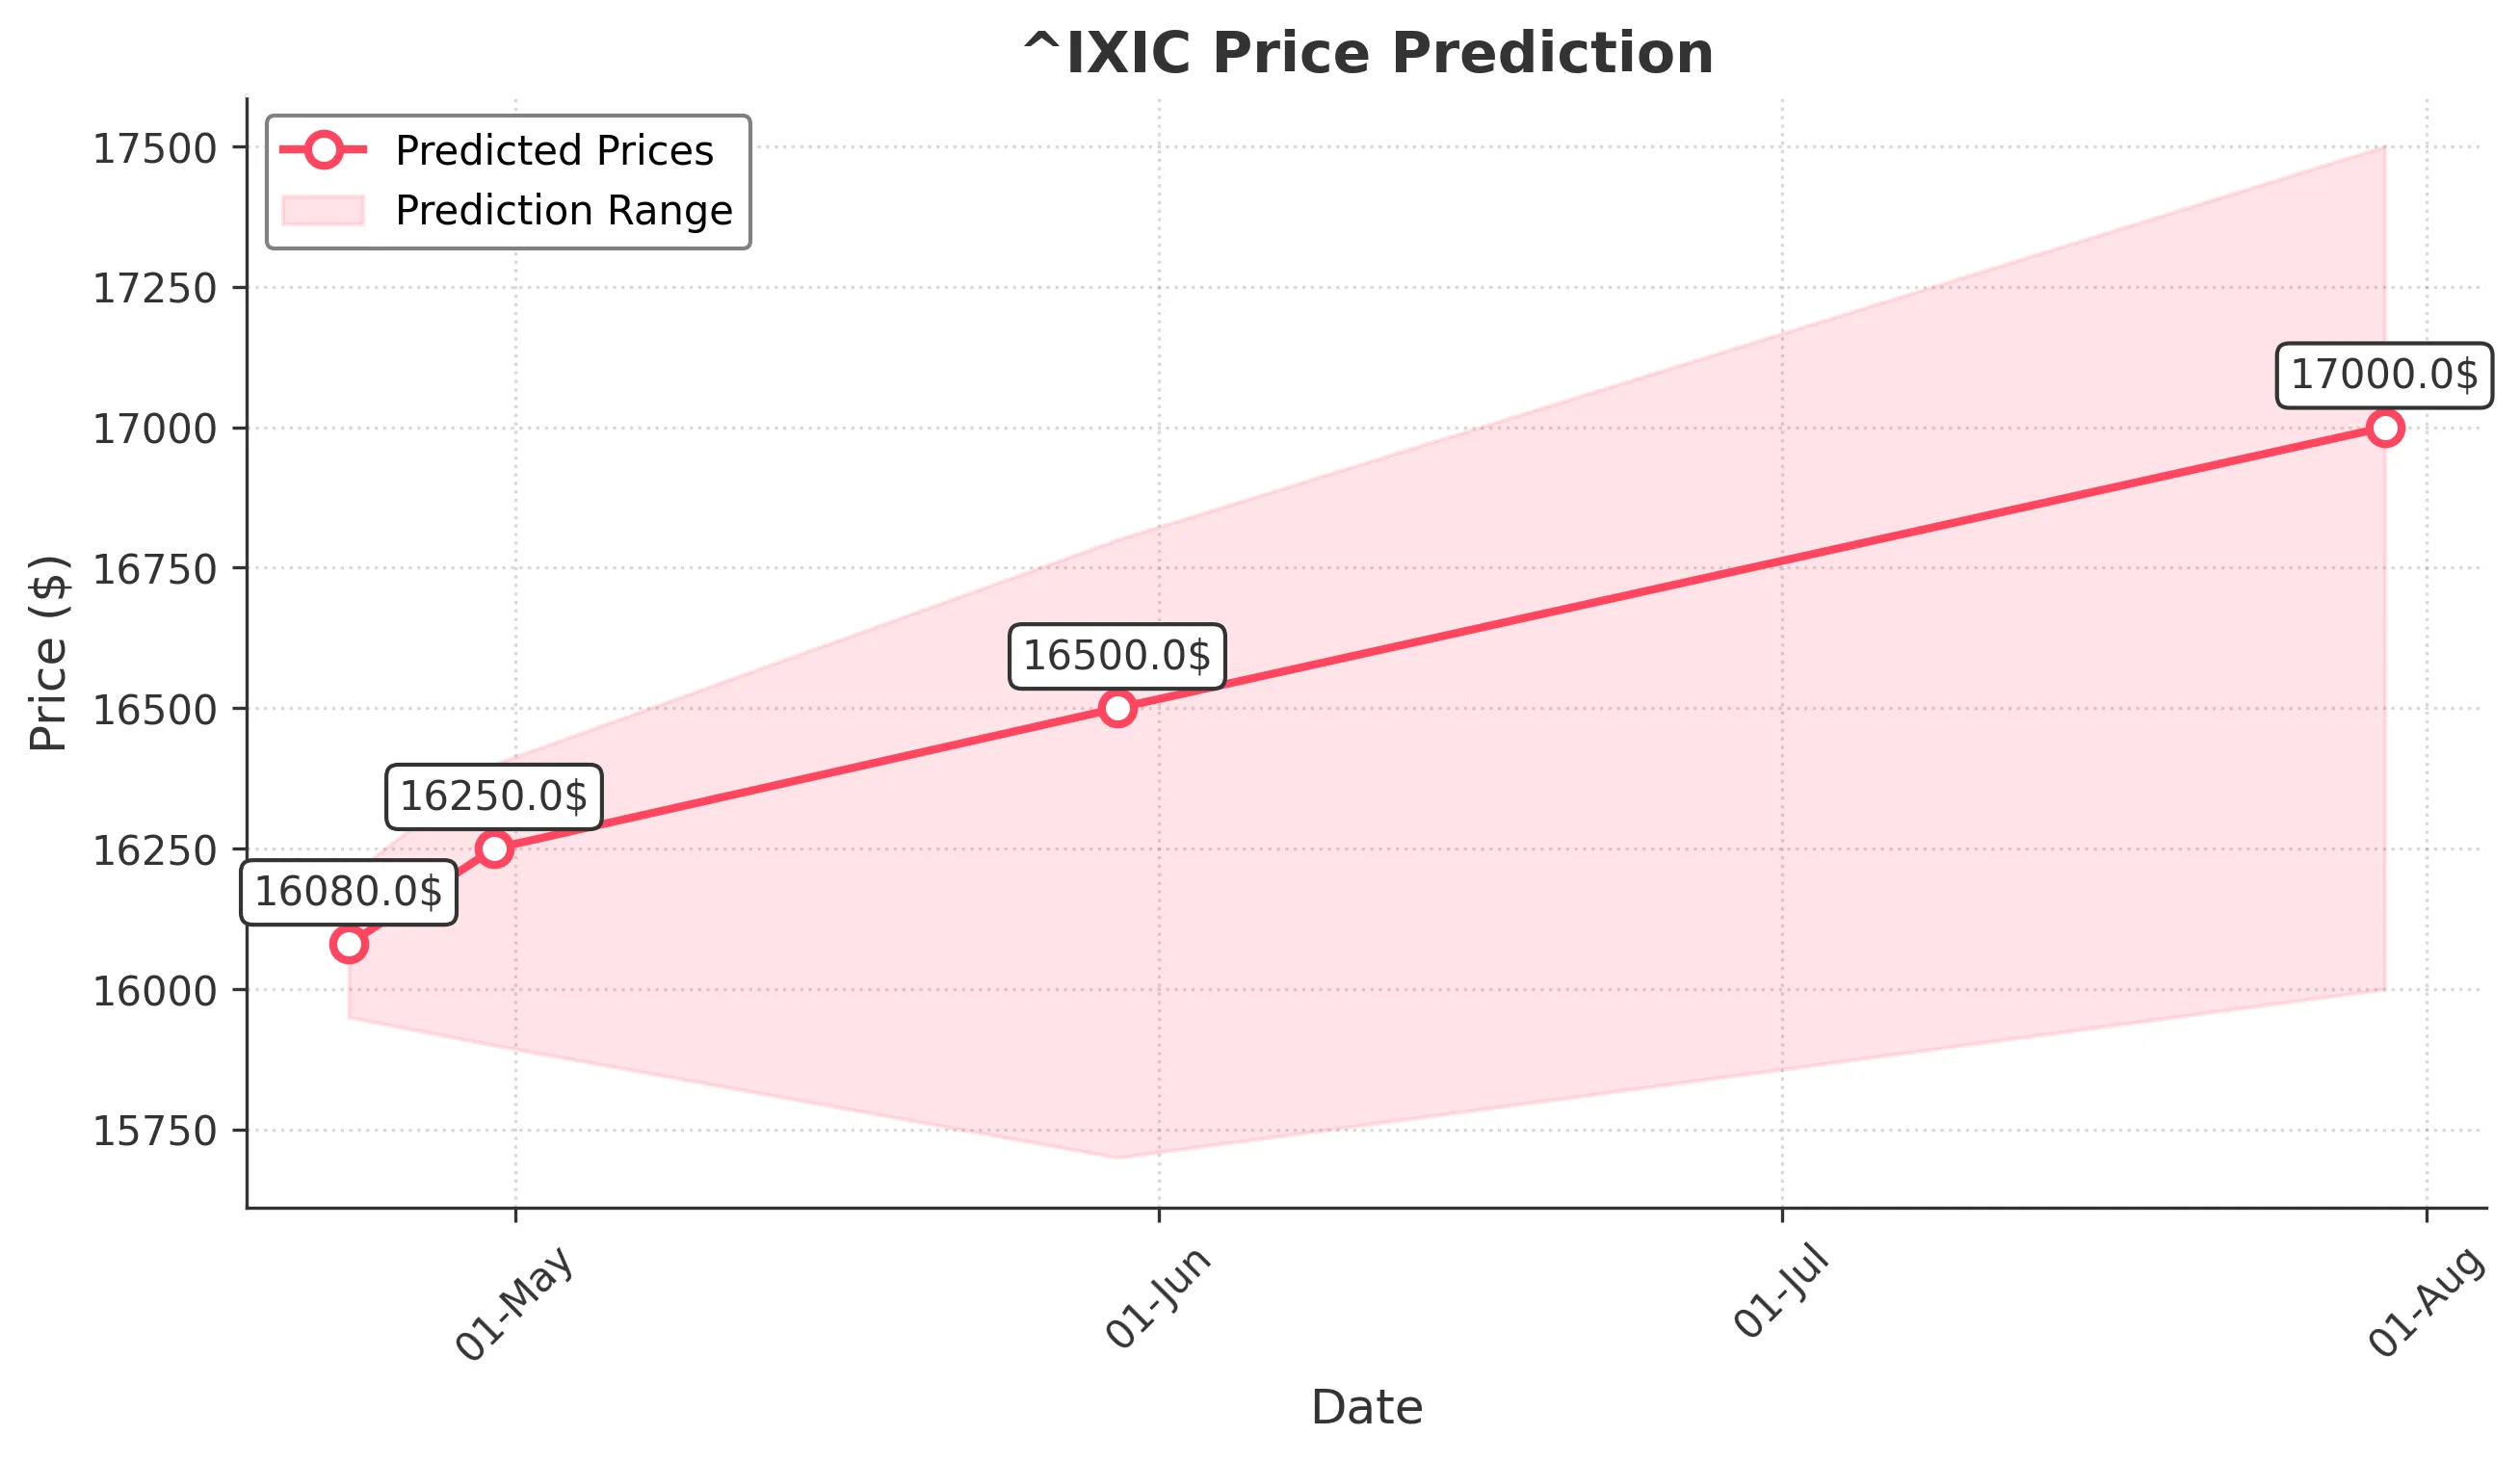
Target: April 23, 2025$16080
$16060
$16200
$15950
Description
The market shows signs of consolidation with a slight bullish bias. The RSI is near 40, indicating potential for upward movement. However, recent volatility suggests caution. A Doji pattern indicates indecision, which may lead to a small rebound.
Analysis
Over the past 3 months, ^IXIC has experienced significant volatility, with a bearish trend recently. Key support at 15870 is critical. The MACD shows a bearish crossover, while Bollinger Bands indicate potential for a bounce. Volume spikes suggest increased trading activity, but overall sentiment remains cautious.
Confidence Level
Potential Risks
Market sentiment is mixed, and external factors could lead to sudden price changes. A bearish trend could emerge if support levels are broken.
1 Week Prediction
Target: April 30, 2025$16250
$16100
$16400
$15900
Description
A potential recovery is indicated as the market may find support at 15870. The RSI is improving, suggesting upward momentum. However, the MACD remains bearish, indicating caution. A bullish engulfing pattern could signal a reversal.
Analysis
The past three months have shown a bearish trend with significant price fluctuations. Key resistance at 16400 needs to be monitored. The ATR indicates high volatility, and recent volume spikes suggest traders are reacting to market news. Overall, the outlook is cautiously optimistic but remains sensitive to external influences.
Confidence Level
Potential Risks
Uncertainty remains due to macroeconomic factors and potential earnings reports that could impact market sentiment. A failure to hold support could lead to further declines.
1 Month Prediction
Target: May 30, 2025$16500
$16400
$16800
$15700
Description
The market may stabilize as it approaches key Fibonacci retracement levels. The RSI is expected to recover, indicating potential bullish momentum. However, the MACD remains a concern, suggesting caution in the near term.
Analysis
The stock has shown a bearish trend with significant volatility. Key support at 15870 is critical, while resistance at 16800 may limit upside potential. The MACD indicates bearish momentum, while volume patterns suggest traders are cautious. Overall, the outlook is mixed, with potential for recovery if support holds.
Confidence Level
Potential Risks
Economic data releases and geopolitical events could significantly impact market direction. A bearish trend could resume if key support levels are breached.
3 Months Prediction
Target: July 30, 2025$17000
$16900
$17500
$16000
Description
If the market stabilizes, a gradual recovery could occur, supported by improving economic indicators. The RSI may indicate bullish momentum, but caution is warranted due to potential resistance at 17500.
Analysis
The past three months have been characterized by high volatility and bearish trends. Key support at 15870 remains critical, while resistance at 17500 could limit upward movement. The MACD indicates bearish momentum, and volume patterns suggest traders are cautious. Overall, the outlook is uncertain, with potential for recovery if economic conditions improve.
Confidence Level
Potential Risks
Long-term predictions are uncertain due to potential economic downturns or unexpected market events. A bearish trend could re-emerge if key levels are not maintained.