NSDQ Trading Predictions
1 Day Prediction
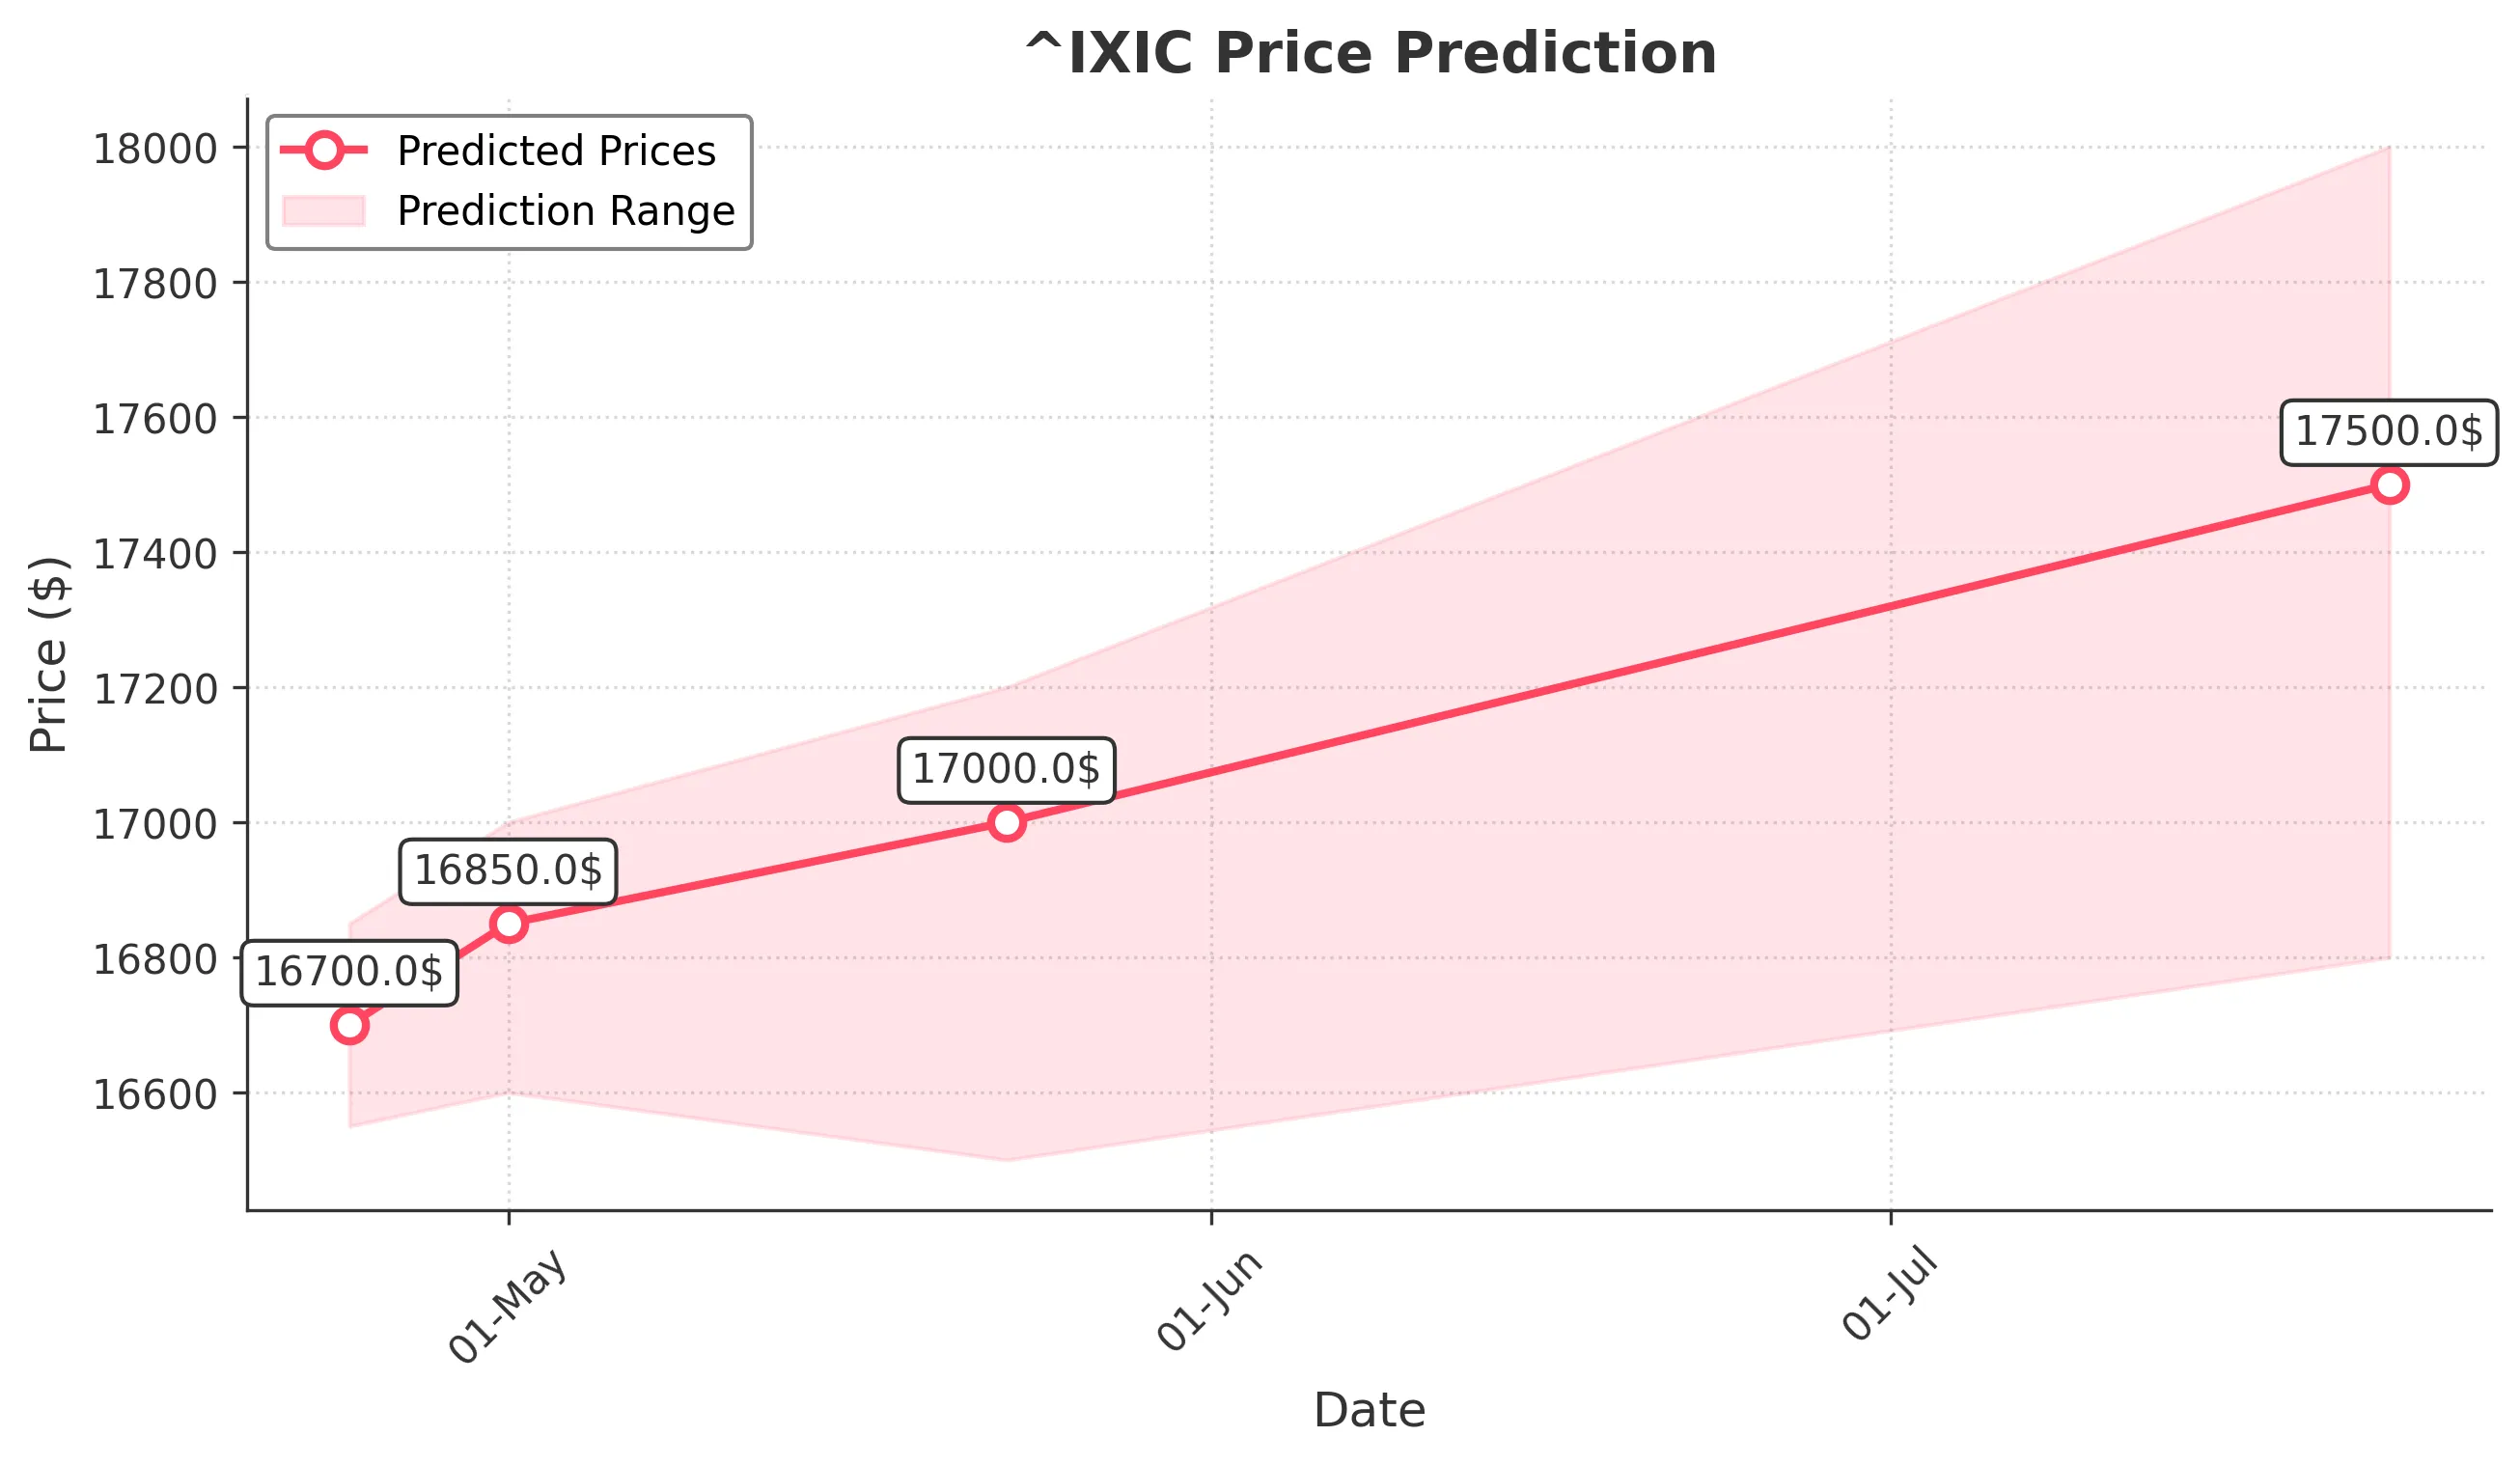
Target: April 24, 2025$16700
$16750
$16850
$16550
Description
The market shows signs of stabilization after recent volatility. The RSI is neutral, and MACD indicates a potential bullish crossover. However, recent bearish candlestick patterns suggest caution. Expect a slight recovery in price.
Analysis
Over the past 3 months, ^IXIC has experienced significant volatility, with a bearish trend recently. Key support at 15870 and resistance around 16850. Volume spikes indicate heightened trading activity, while the ATR suggests increased volatility. The market sentiment is mixed, influenced by macroeconomic factors.
Confidence Level
Potential Risks
Market sentiment remains fragile, and external news could impact trading significantly.
1 Week Prediction
Target: May 1, 2025$16850
$16750
$17000
$16600
Description
A potential upward movement is indicated by the recent bullish engulfing pattern. The MACD is showing signs of recovery, and the RSI is approaching oversold territory. However, resistance at 17000 may limit gains.
Analysis
The index has been in a bearish phase, but recent patterns suggest a possible reversal. Key support at 15870 remains critical. The volume analysis shows increased activity, indicating traders are reacting to market conditions. The overall sentiment is cautious but slightly improving.
Confidence Level
Potential Risks
Uncertainty in macroeconomic indicators could lead to unexpected market reactions.
1 Month Prediction
Target: May 23, 2025$17000
$16900
$17200
$16500
Description
If the bullish momentum continues, we could see a gradual rise towards 17000. The MACD is turning positive, and the RSI is recovering. However, external economic factors could pose risks to this upward trend.
Analysis
The index has shown a bearish trend recently, but signs of recovery are emerging. Key resistance at 17000 could be tested if bullish momentum builds. Volume patterns indicate traders are cautiously optimistic, but macroeconomic uncertainties remain a concern.
Confidence Level
Potential Risks
Potential economic downturns or geopolitical tensions could reverse the trend.
3 Months Prediction
Target: July 23, 2025$17500
$17200
$18000
$16800
Description
If the current recovery trend continues, we may see the index approach 17500. The technical indicators suggest a bullish reversal, but market volatility and external factors could impact this trajectory.
Analysis
The past three months have been marked by significant volatility and bearish trends. Key support levels are critical, and while there are signs of recovery, the market remains sensitive to external influences. The overall sentiment is cautiously optimistic, but risks persist.
Confidence Level
Potential Risks
Economic indicators and potential market corrections could derail the upward trend.