NSDQ Trading Predictions
1 Day Prediction
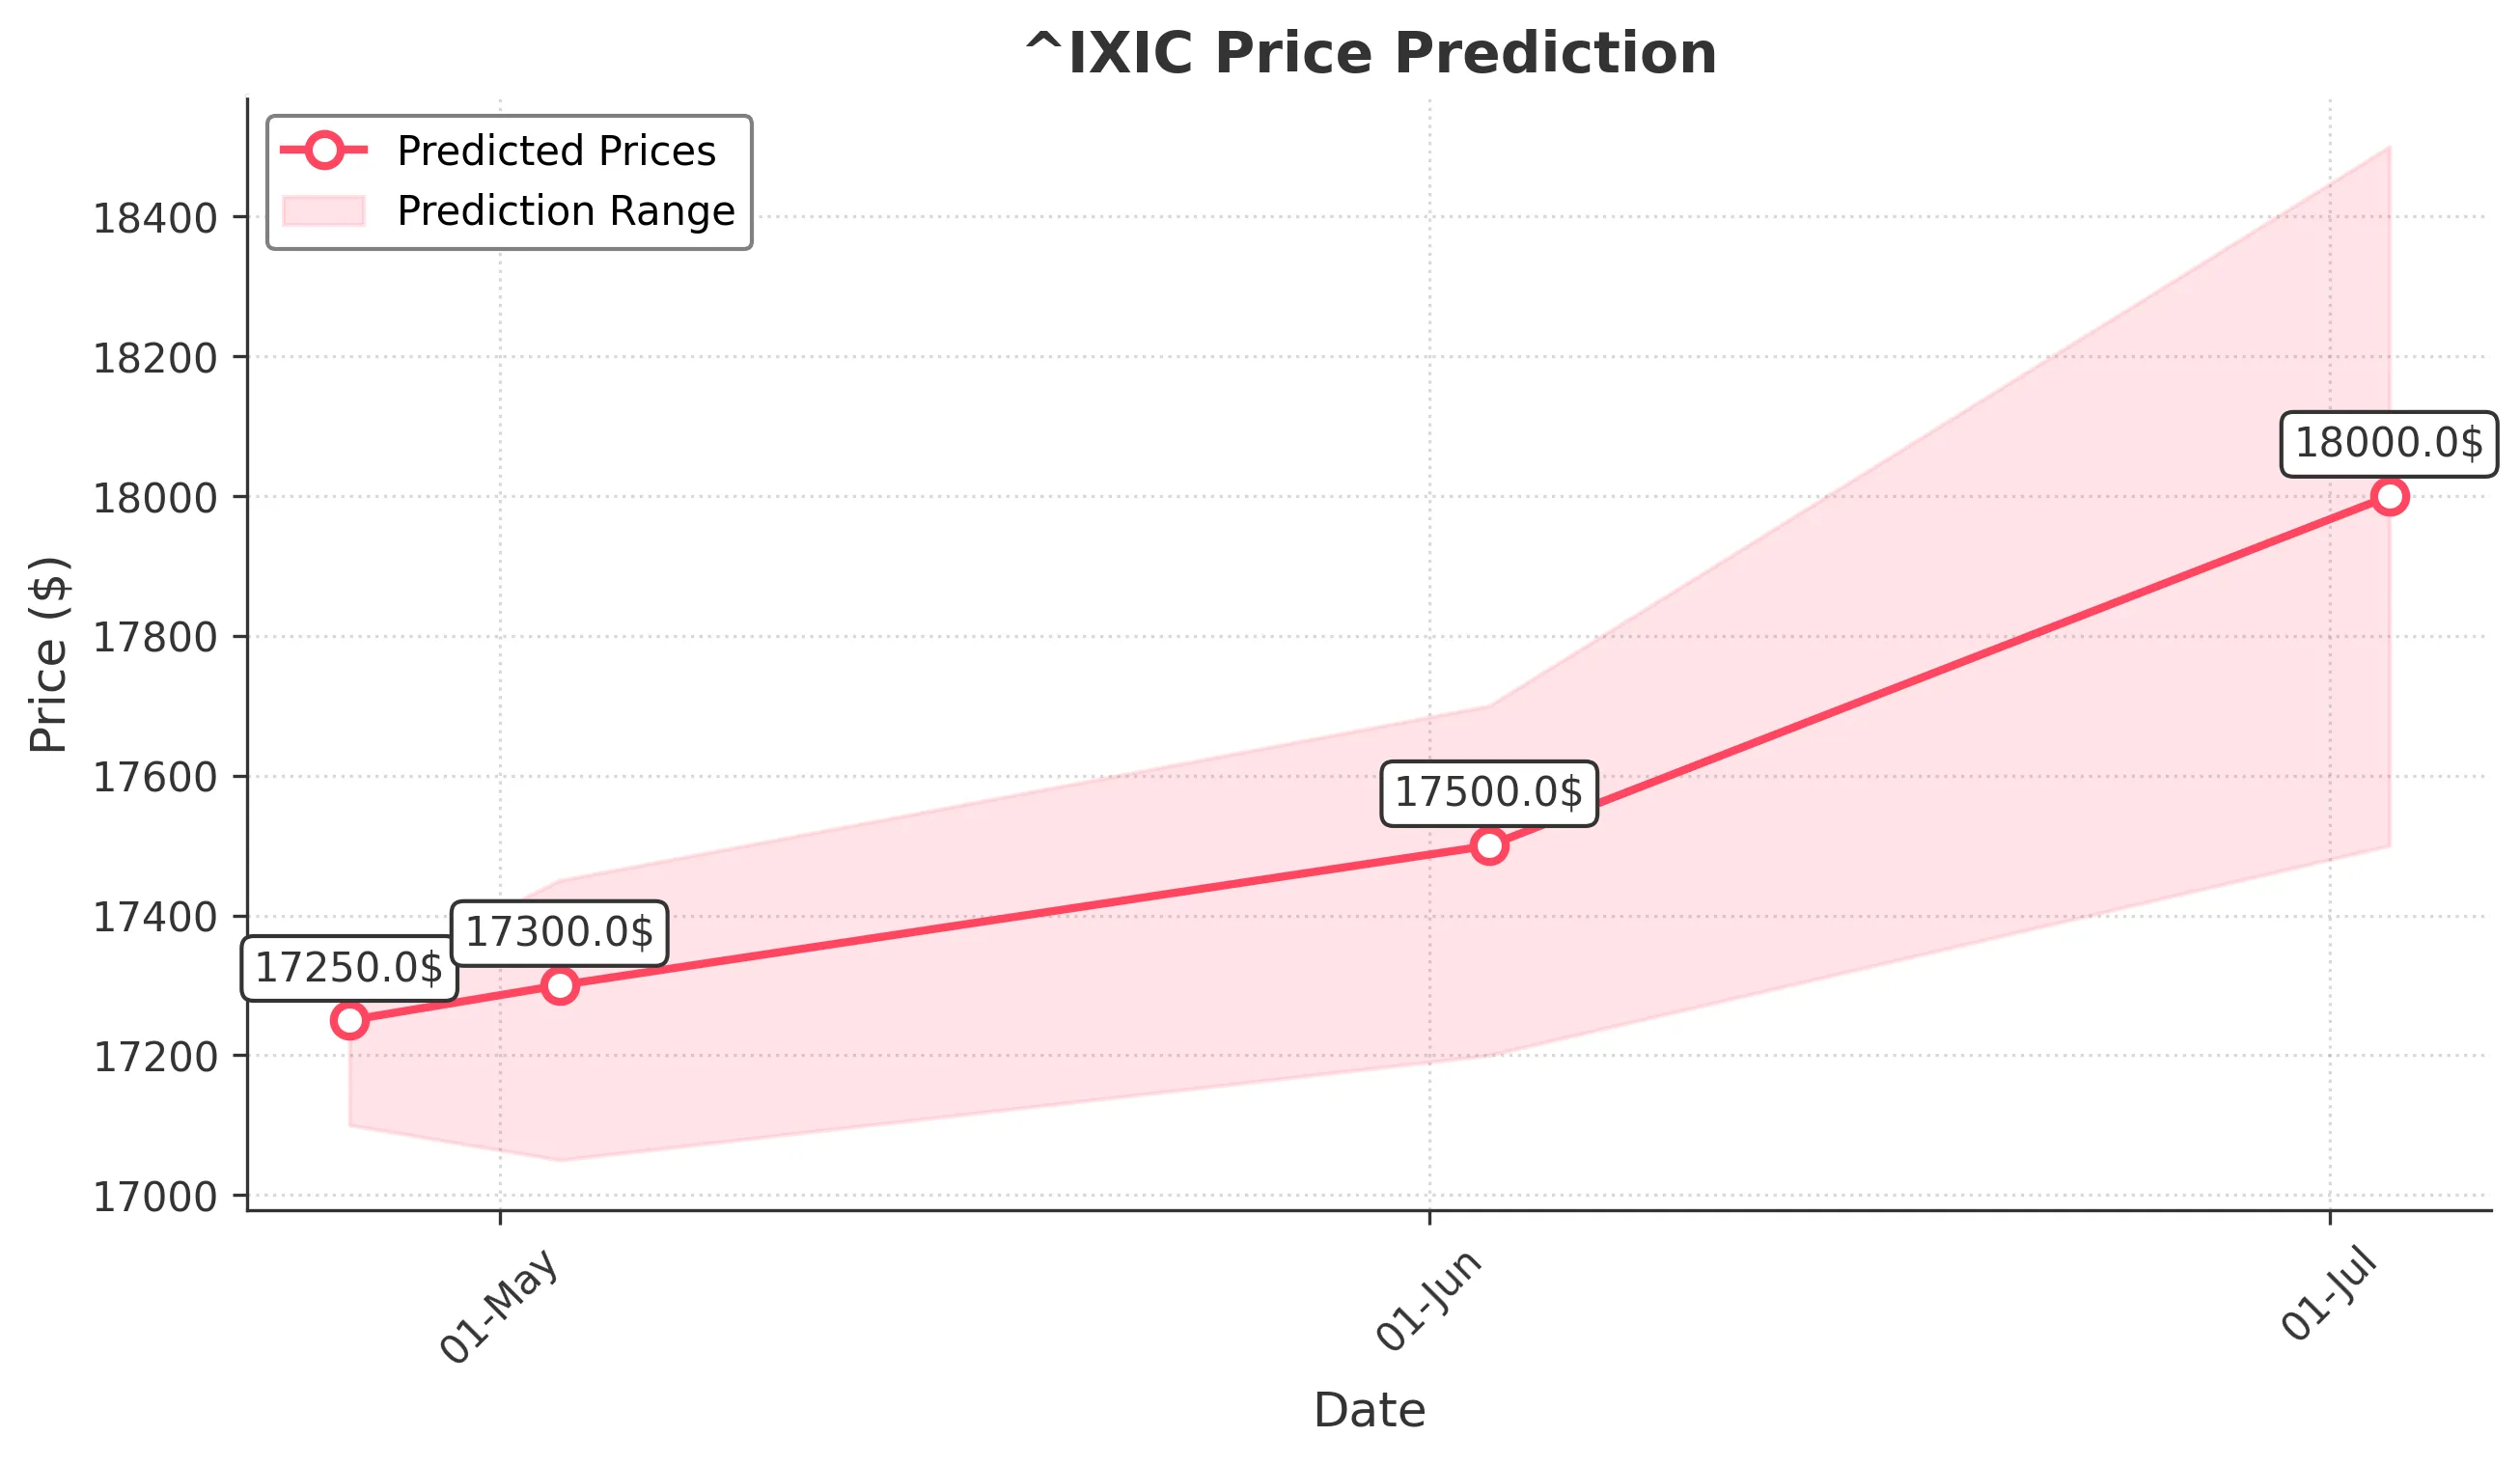
Target: April 26, 2025$17250
$17200
$17300
$17100
Description
The market shows signs of stabilization after recent volatility. The RSI is neutral, and MACD indicates a potential bullish crossover. However, recent bearish candlestick patterns suggest caution. Volume remains elevated, indicating strong interest.
Analysis
Over the past 3 months, ^IXIC has experienced significant volatility, with a bearish trend recently. Key support at 17000 and resistance at 17500. The RSI indicates potential oversold conditions, while MACD shows mixed signals. Volume spikes suggest active trading, but uncertainty remains.
Confidence Level
Potential Risks
Market sentiment could shift due to external news or economic data releases, which may impact trading behavior.
1 Week Prediction
Target: May 3, 2025$17300
$17250
$17450
$17050
Description
A slight upward trend is expected as the market digests recent losses. The Bollinger Bands indicate potential for a rebound, but caution is warranted due to recent bearish patterns. Volume may increase as traders react to market news.
Analysis
The index has shown a bearish trend with significant fluctuations. Support at 17000 is critical, while resistance at 17500 remains. Technical indicators suggest a possible short-term recovery, but overall sentiment is cautious.
Confidence Level
Potential Risks
Potential for further downside exists if economic indicators disappoint or if geopolitical tensions escalate.
1 Month Prediction
Target: June 3, 2025$17500
$17350
$17700
$17200
Description
Expect a gradual recovery as the market stabilizes. The Fibonacci retracement levels suggest potential support at 17200. However, macroeconomic factors could influence volatility. Watch for bullish signals in the coming weeks.
Analysis
The past three months have been marked by volatility and bearish trends. Key support at 17000 and resistance at 17500. Technical indicators show potential for recovery, but external factors could introduce risks.
Confidence Level
Potential Risks
Economic data releases and corporate earnings could lead to unexpected volatility, impacting the forecast.
3 Months Prediction
Target: July 3, 2025$18000
$17800
$18500
$17500
Description
A more optimistic outlook as the market may recover from recent lows. Technical indicators suggest a bullish reversal, but external economic conditions must be monitored closely. Volume trends indicate increasing investor interest.
Analysis
The index has faced significant challenges, with a bearish trend recently. Key support at 17000 and resistance at 18000. Technical indicators suggest potential for recovery, but external factors could introduce volatility.
Confidence Level
Potential Risks
Unforeseen economic events or changes in market sentiment could derail the recovery, leading to potential declines.