NSDQ Trading Predictions
1 Day Prediction
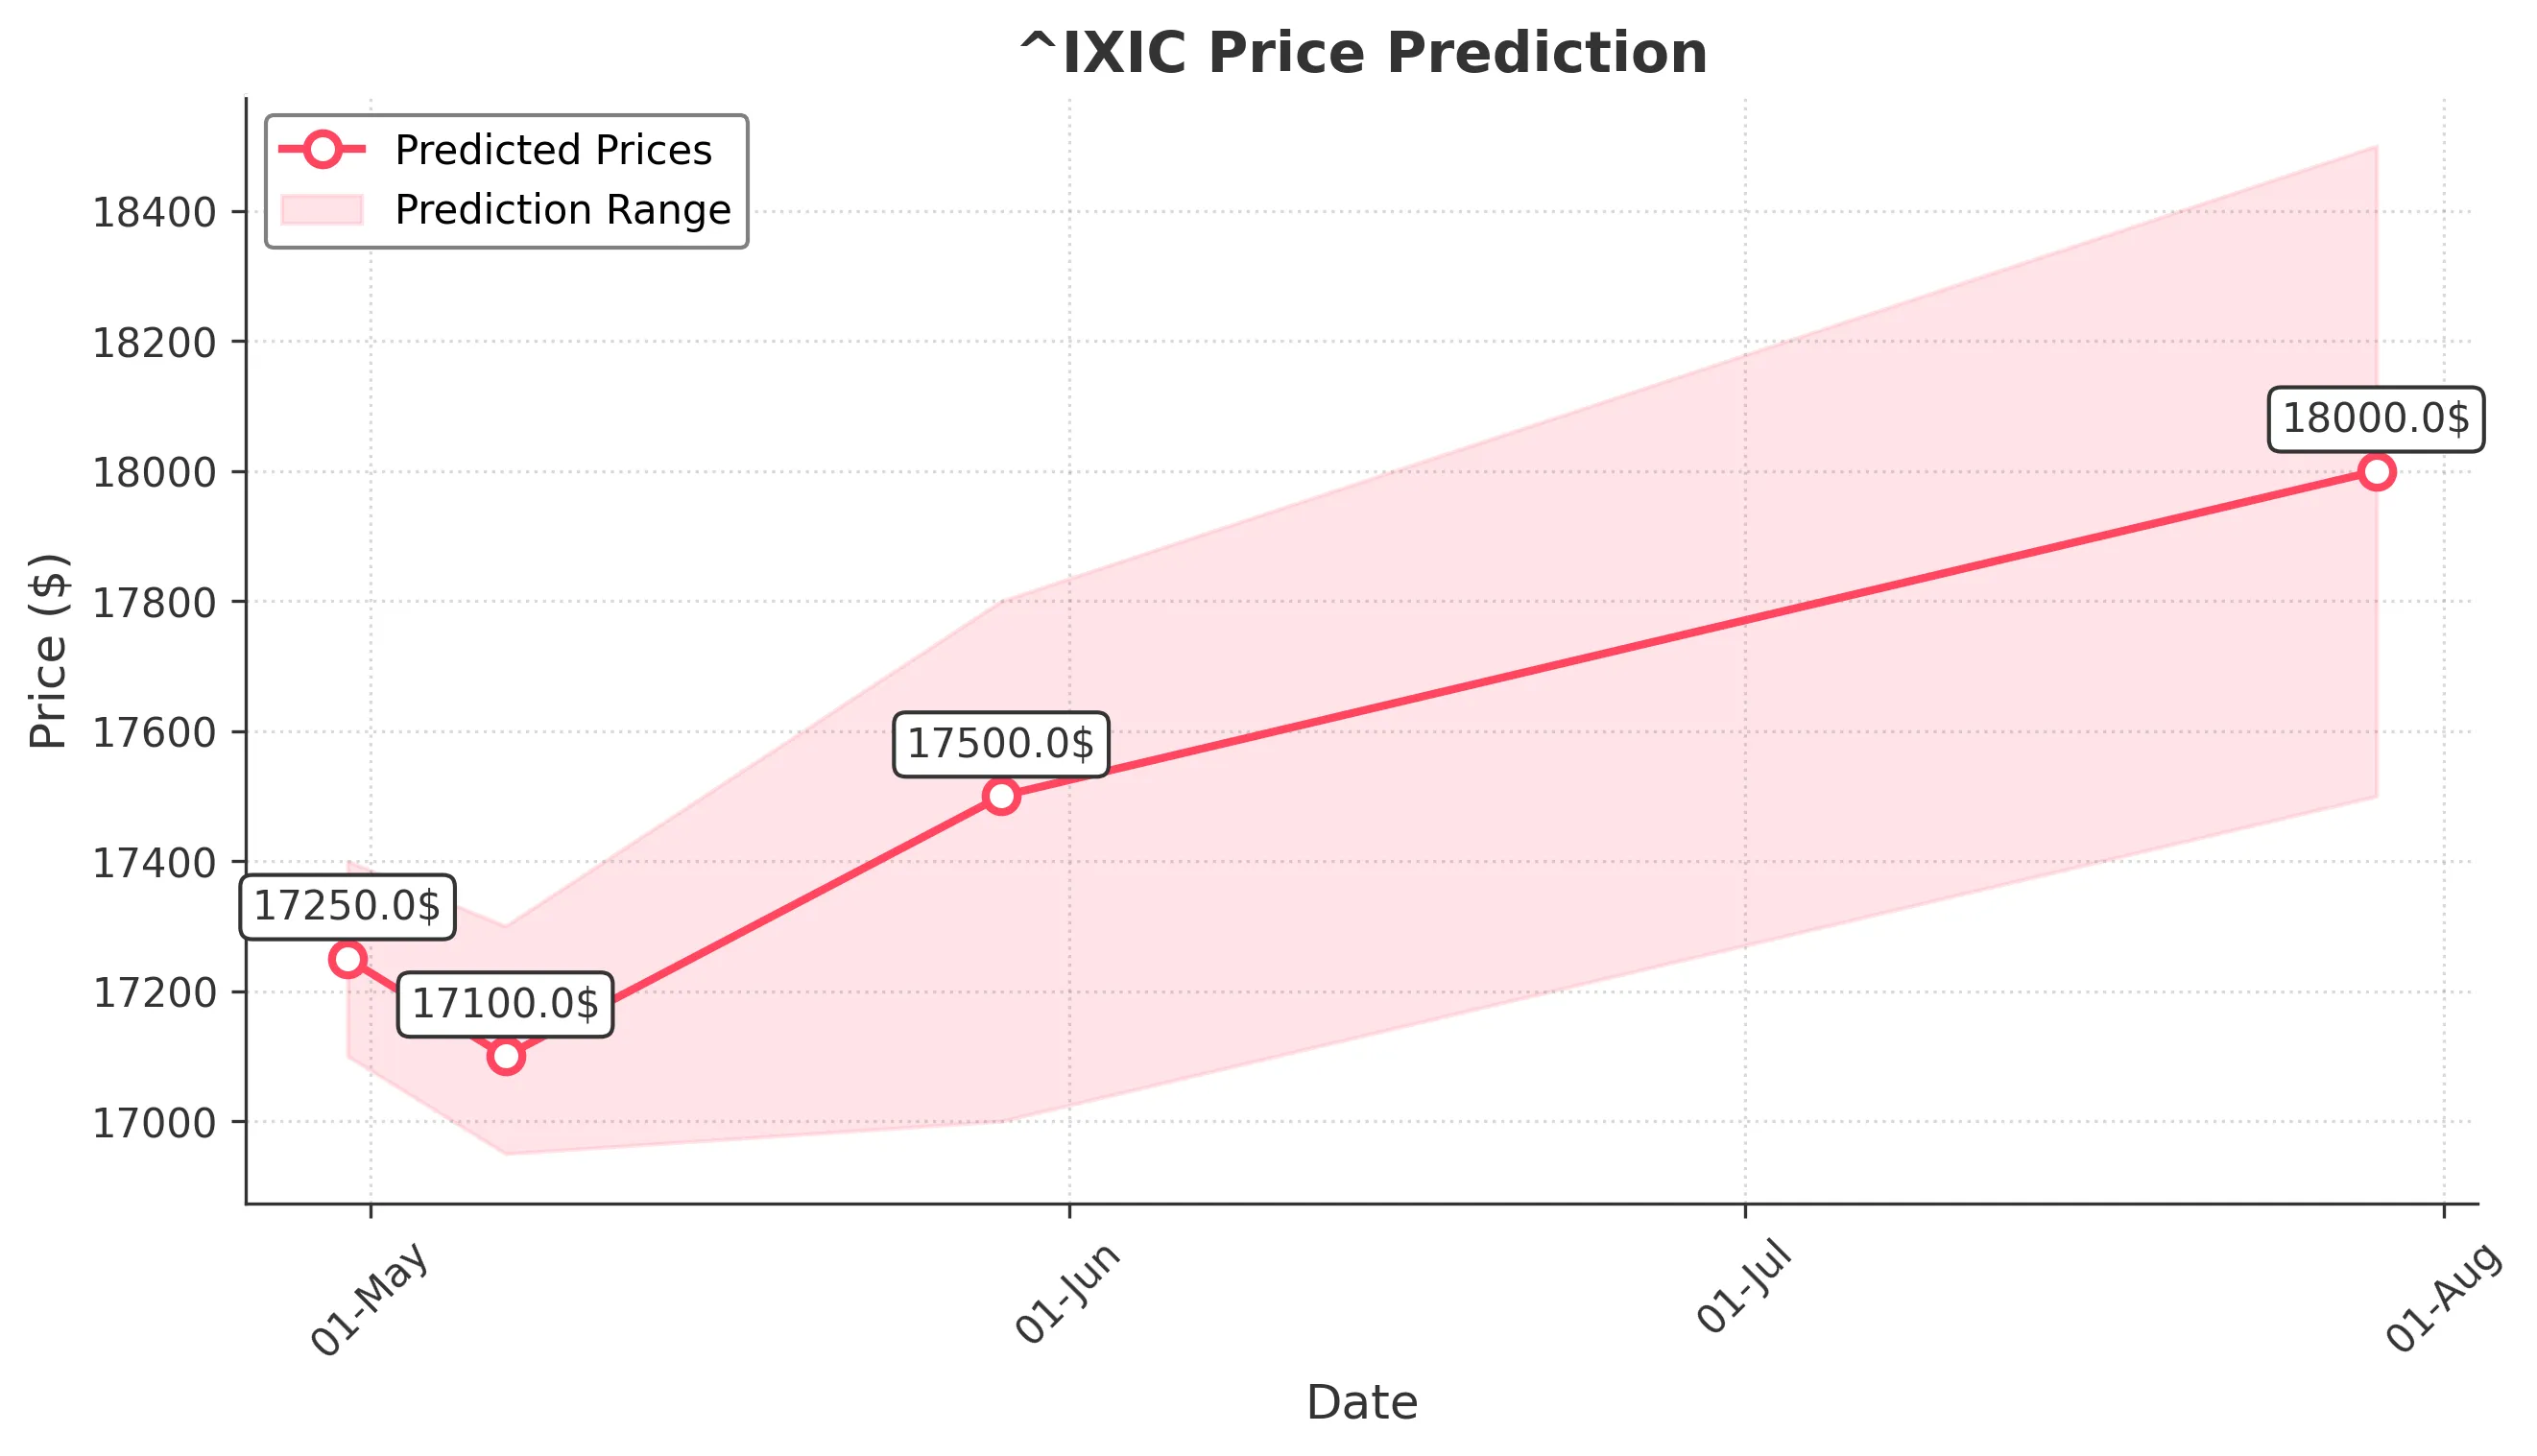
Target: April 30, 2025$17250
$17280
$17400
$17100
Description
The market shows signs of consolidation with a slight bearish trend. The RSI is approaching oversold levels, indicating potential for a bounce. However, recent volatility and lower volume suggest caution. Expect a close around 17250.
Analysis
Over the past 3 months, ^IXIC has experienced significant volatility, with a bearish trend recently. Key support is around 17100, while resistance is near 17500. The MACD shows bearish momentum, and the ATR indicates high volatility. Volume has been inconsistent, with spikes during sell-offs.
Confidence Level
Potential Risks
Market sentiment is fragile, and any negative news could lead to further declines. Watch for volume spikes that may indicate a reversal.
1 Week Prediction
Target: May 7, 2025$17100
$17150
$17300
$16950
Description
The bearish trend may continue into next week, with potential for a test of support at 17000. The market is reacting to macroeconomic concerns, and the RSI indicates oversold conditions, suggesting a possible short-term bounce.
Analysis
The past three months have shown a bearish trend with significant sell-offs. Key support at 17000 is critical, while resistance remains at 17500. The MACD is bearish, and the RSI is low, indicating potential for a bounce but also risk of further declines.
Confidence Level
Potential Risks
Uncertainty in economic data releases could impact market direction. A break below 17000 could trigger further selling.
1 Month Prediction
Target: May 29, 2025$17500
$17300
$17800
$17000
Description
Expect a potential recovery as the market may find support around 17000. If economic conditions stabilize, a rally towards 17500 is possible. Watch for bullish candlestick patterns for confirmation.
Analysis
The stock has been in a bearish phase, but signs of stabilization are emerging. Key support at 17000 and resistance at 17800 are critical. The MACD is showing signs of potential bullish divergence, while the RSI is recovering from oversold levels.
Confidence Level
Potential Risks
Economic indicators and geopolitical events could derail recovery efforts. A failure to hold above 17000 could lead to renewed selling pressure.
3 Months Prediction
Target: July 29, 2025$18000
$17800
$18500
$17500
Description
If the market stabilizes and economic conditions improve, a gradual recovery towards 18000 is feasible. Watch for bullish patterns and volume increases as confirmation of upward momentum.
Analysis
The overall trend has been bearish, but potential for recovery exists if key support levels hold. The market is sensitive to macroeconomic factors, and the ATR indicates ongoing volatility. Resistance at 18500 will be crucial for any upward movement.
Confidence Level
Potential Risks
Long-term uncertainties remain, including inflation and interest rate changes. A failure to break above 18000 could lead to renewed bearish sentiment.