NSDQ Trading Predictions
1 Day Prediction
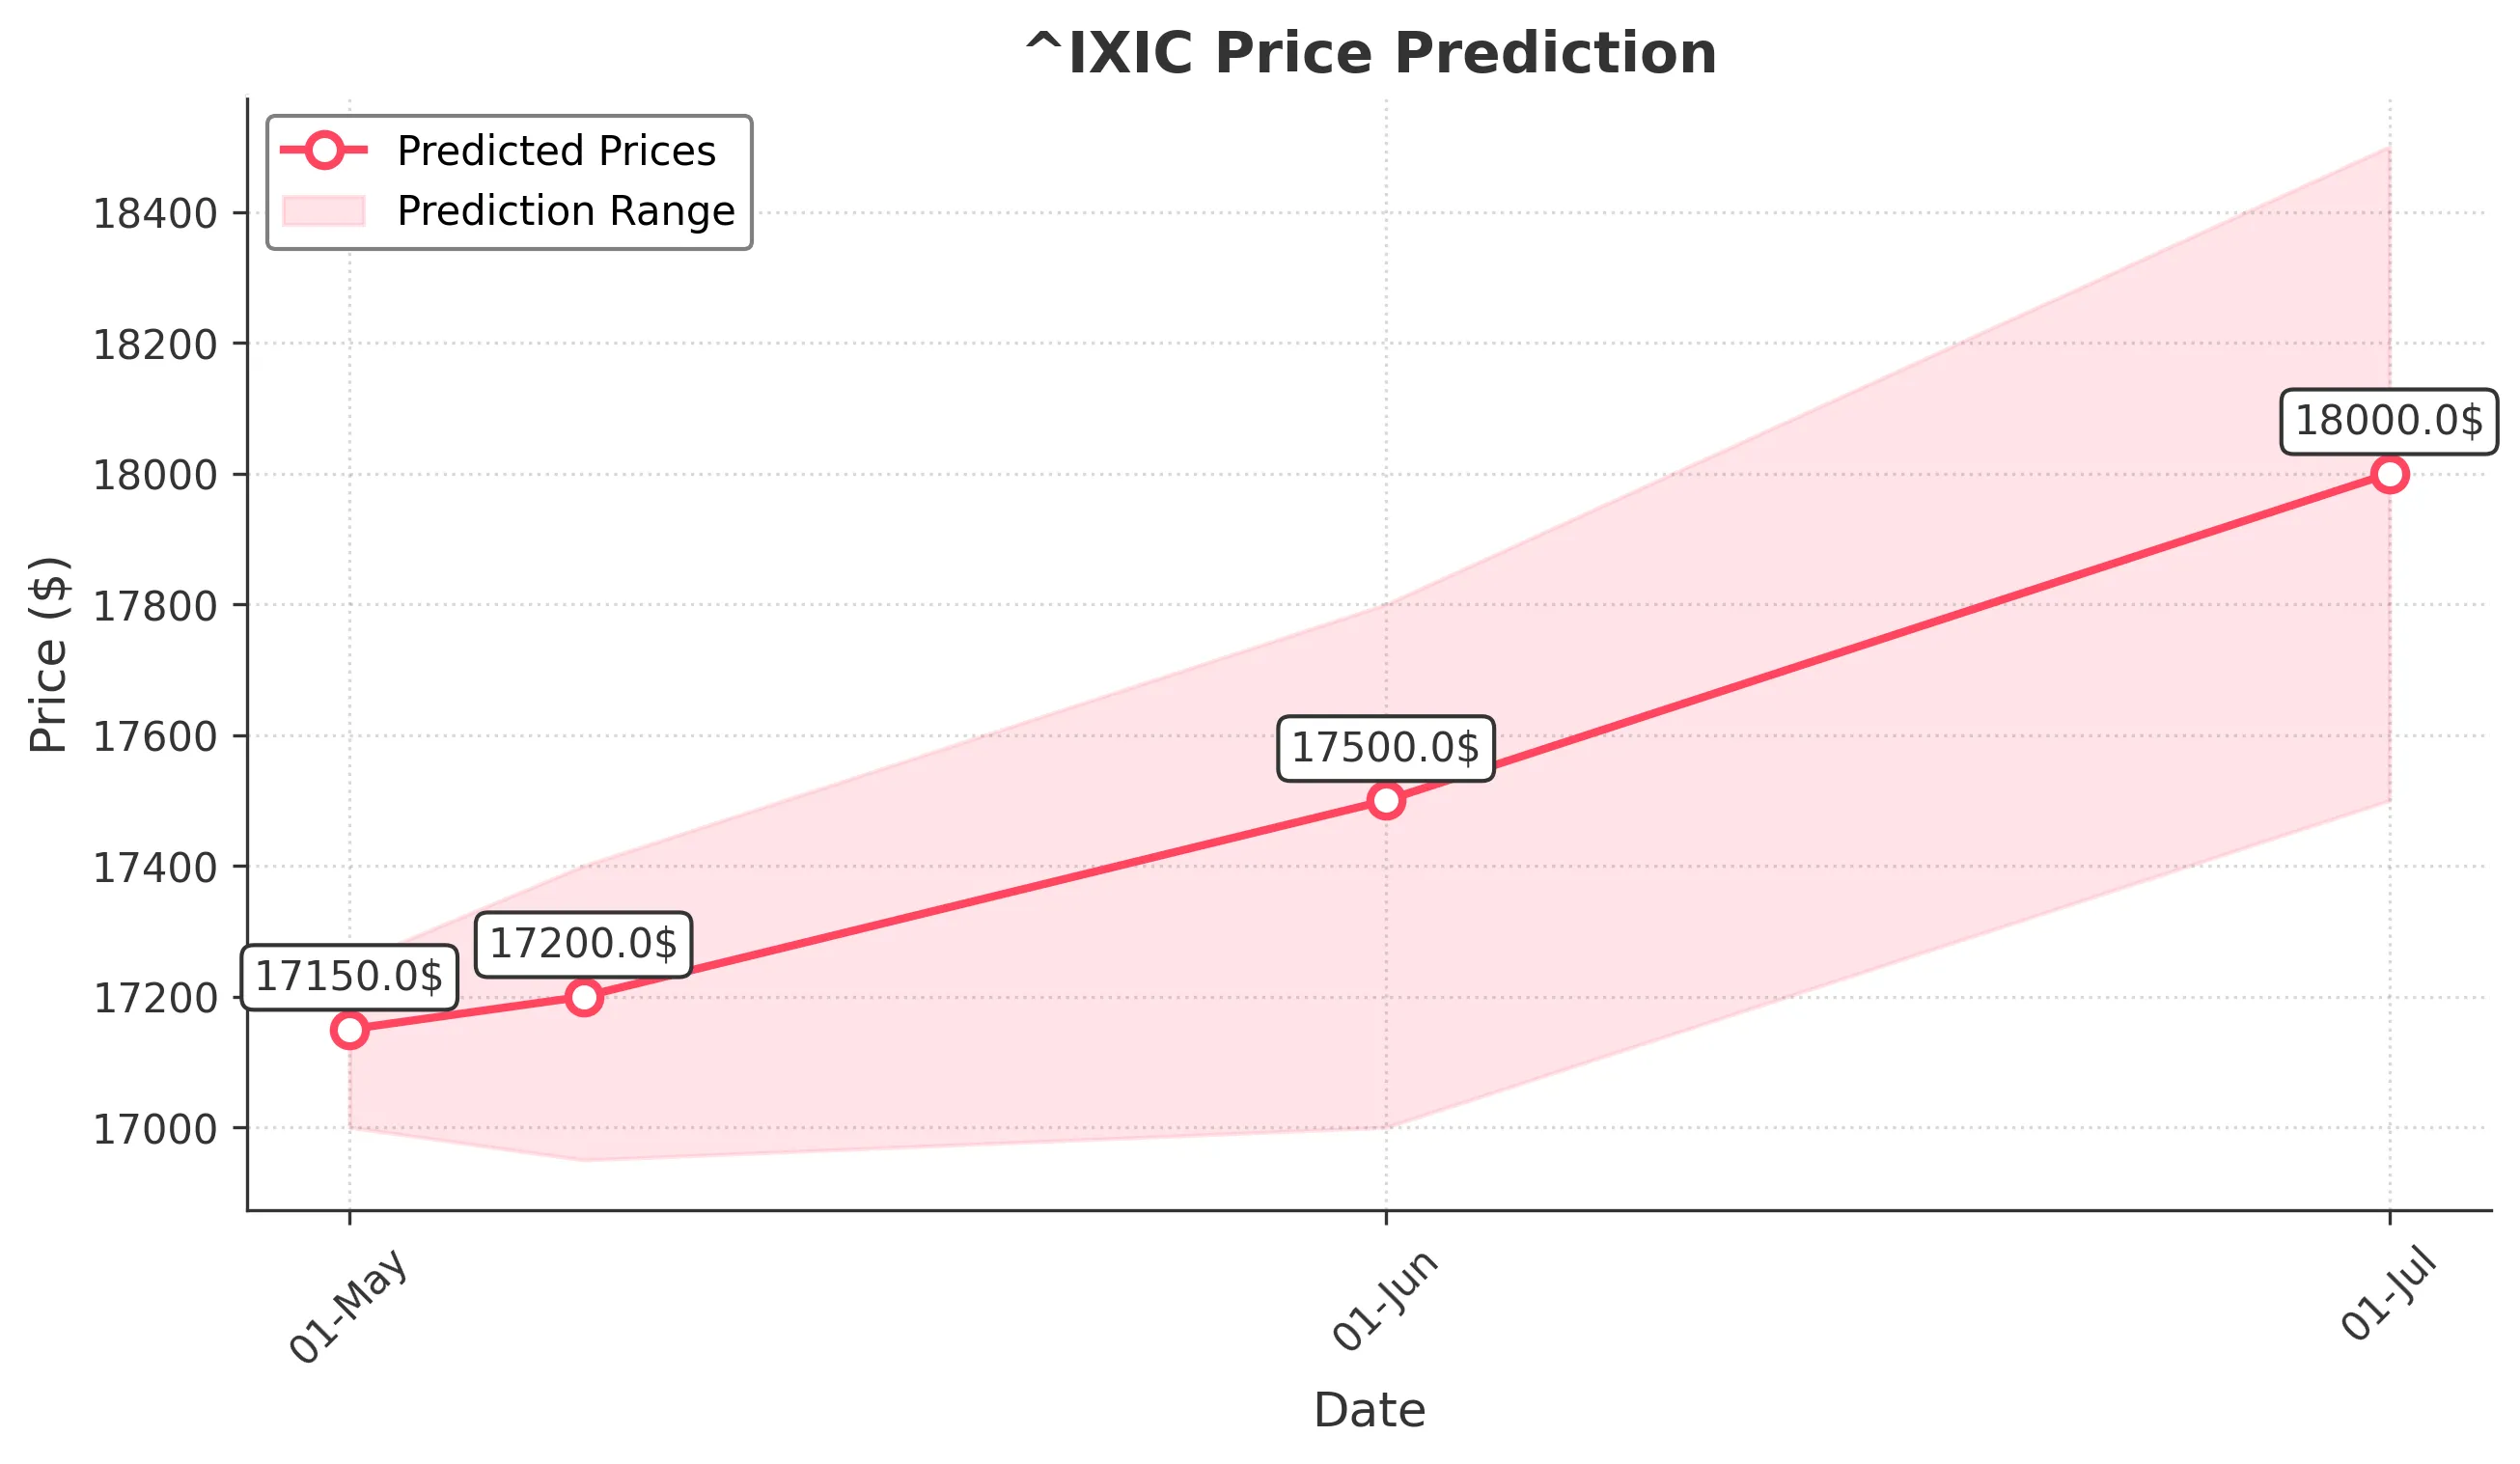
Target: May 1, 2025$17150
$17100
$17250
$17000
Description
The market shows signs of stabilization after recent volatility. The RSI is neutral, and MACD indicates a potential bullish crossover. However, recent bearish candlestick patterns suggest caution. Volume is expected to remain high as traders react to macroeconomic news.
Analysis
Over the past 3 months, ^IXIC has experienced significant fluctuations, with a bearish trend recently. Key support at 17000 and resistance at 17500. The RSI indicates potential oversold conditions, while MACD shows mixed signals. Volume spikes during sell-offs suggest heightened trader activity.
Confidence Level
Potential Risks
Market sentiment could shift rapidly due to external news or earnings reports, which may lead to unexpected volatility.
1 Week Prediction
Target: May 8, 2025$17200
$17150
$17400
$16950
Description
A slight upward trend is anticipated as the market digests recent economic data. The Bollinger Bands indicate potential for a breakout, while the MACD remains bullish. However, caution is warranted due to recent bearish patterns.
Analysis
The index has shown a bearish trend recently, with significant resistance at 17500. Volume analysis indicates increased selling pressure, but recent price action suggests a possible reversal. Technical indicators are mixed, with the RSI approaching oversold levels.
Confidence Level
Potential Risks
Potential for market corrections exists, especially if economic indicators disappoint or geopolitical tensions escalate.
1 Month Prediction
Target: June 1, 2025$17500
$17250
$17800
$17000
Description
Expect a gradual recovery as market sentiment improves. The Fibonacci retracement levels suggest support around 17000, with potential resistance at 17800. The MACD indicates a bullish trend, but caution is advised due to potential volatility.
Analysis
The past three months have seen significant volatility, with a bearish trend recently. Key support at 17000 and resistance at 17800. The RSI is recovering, indicating potential for upward movement. Volume patterns suggest traders are positioning for a rebound.
Confidence Level
Potential Risks
Economic data releases and earnings reports could impact market direction, leading to unexpected volatility.
3 Months Prediction
Target: July 1, 2025$18000
$17750
$18500
$17500
Description
A bullish outlook is anticipated as economic conditions stabilize. The MACD shows a strong bullish signal, and the RSI indicates upward momentum. However, external factors could introduce volatility.
Analysis
The index has faced significant challenges over the past three months, with a bearish trend recently. Key support at 17500 and resistance at 18500. Technical indicators suggest a potential recovery, but market sentiment remains fragile, influenced by macroeconomic factors.
Confidence Level
Potential Risks
Unforeseen economic events or geopolitical tensions could disrupt the anticipated upward trend.