NSDQ Trading Predictions
1 Day Prediction
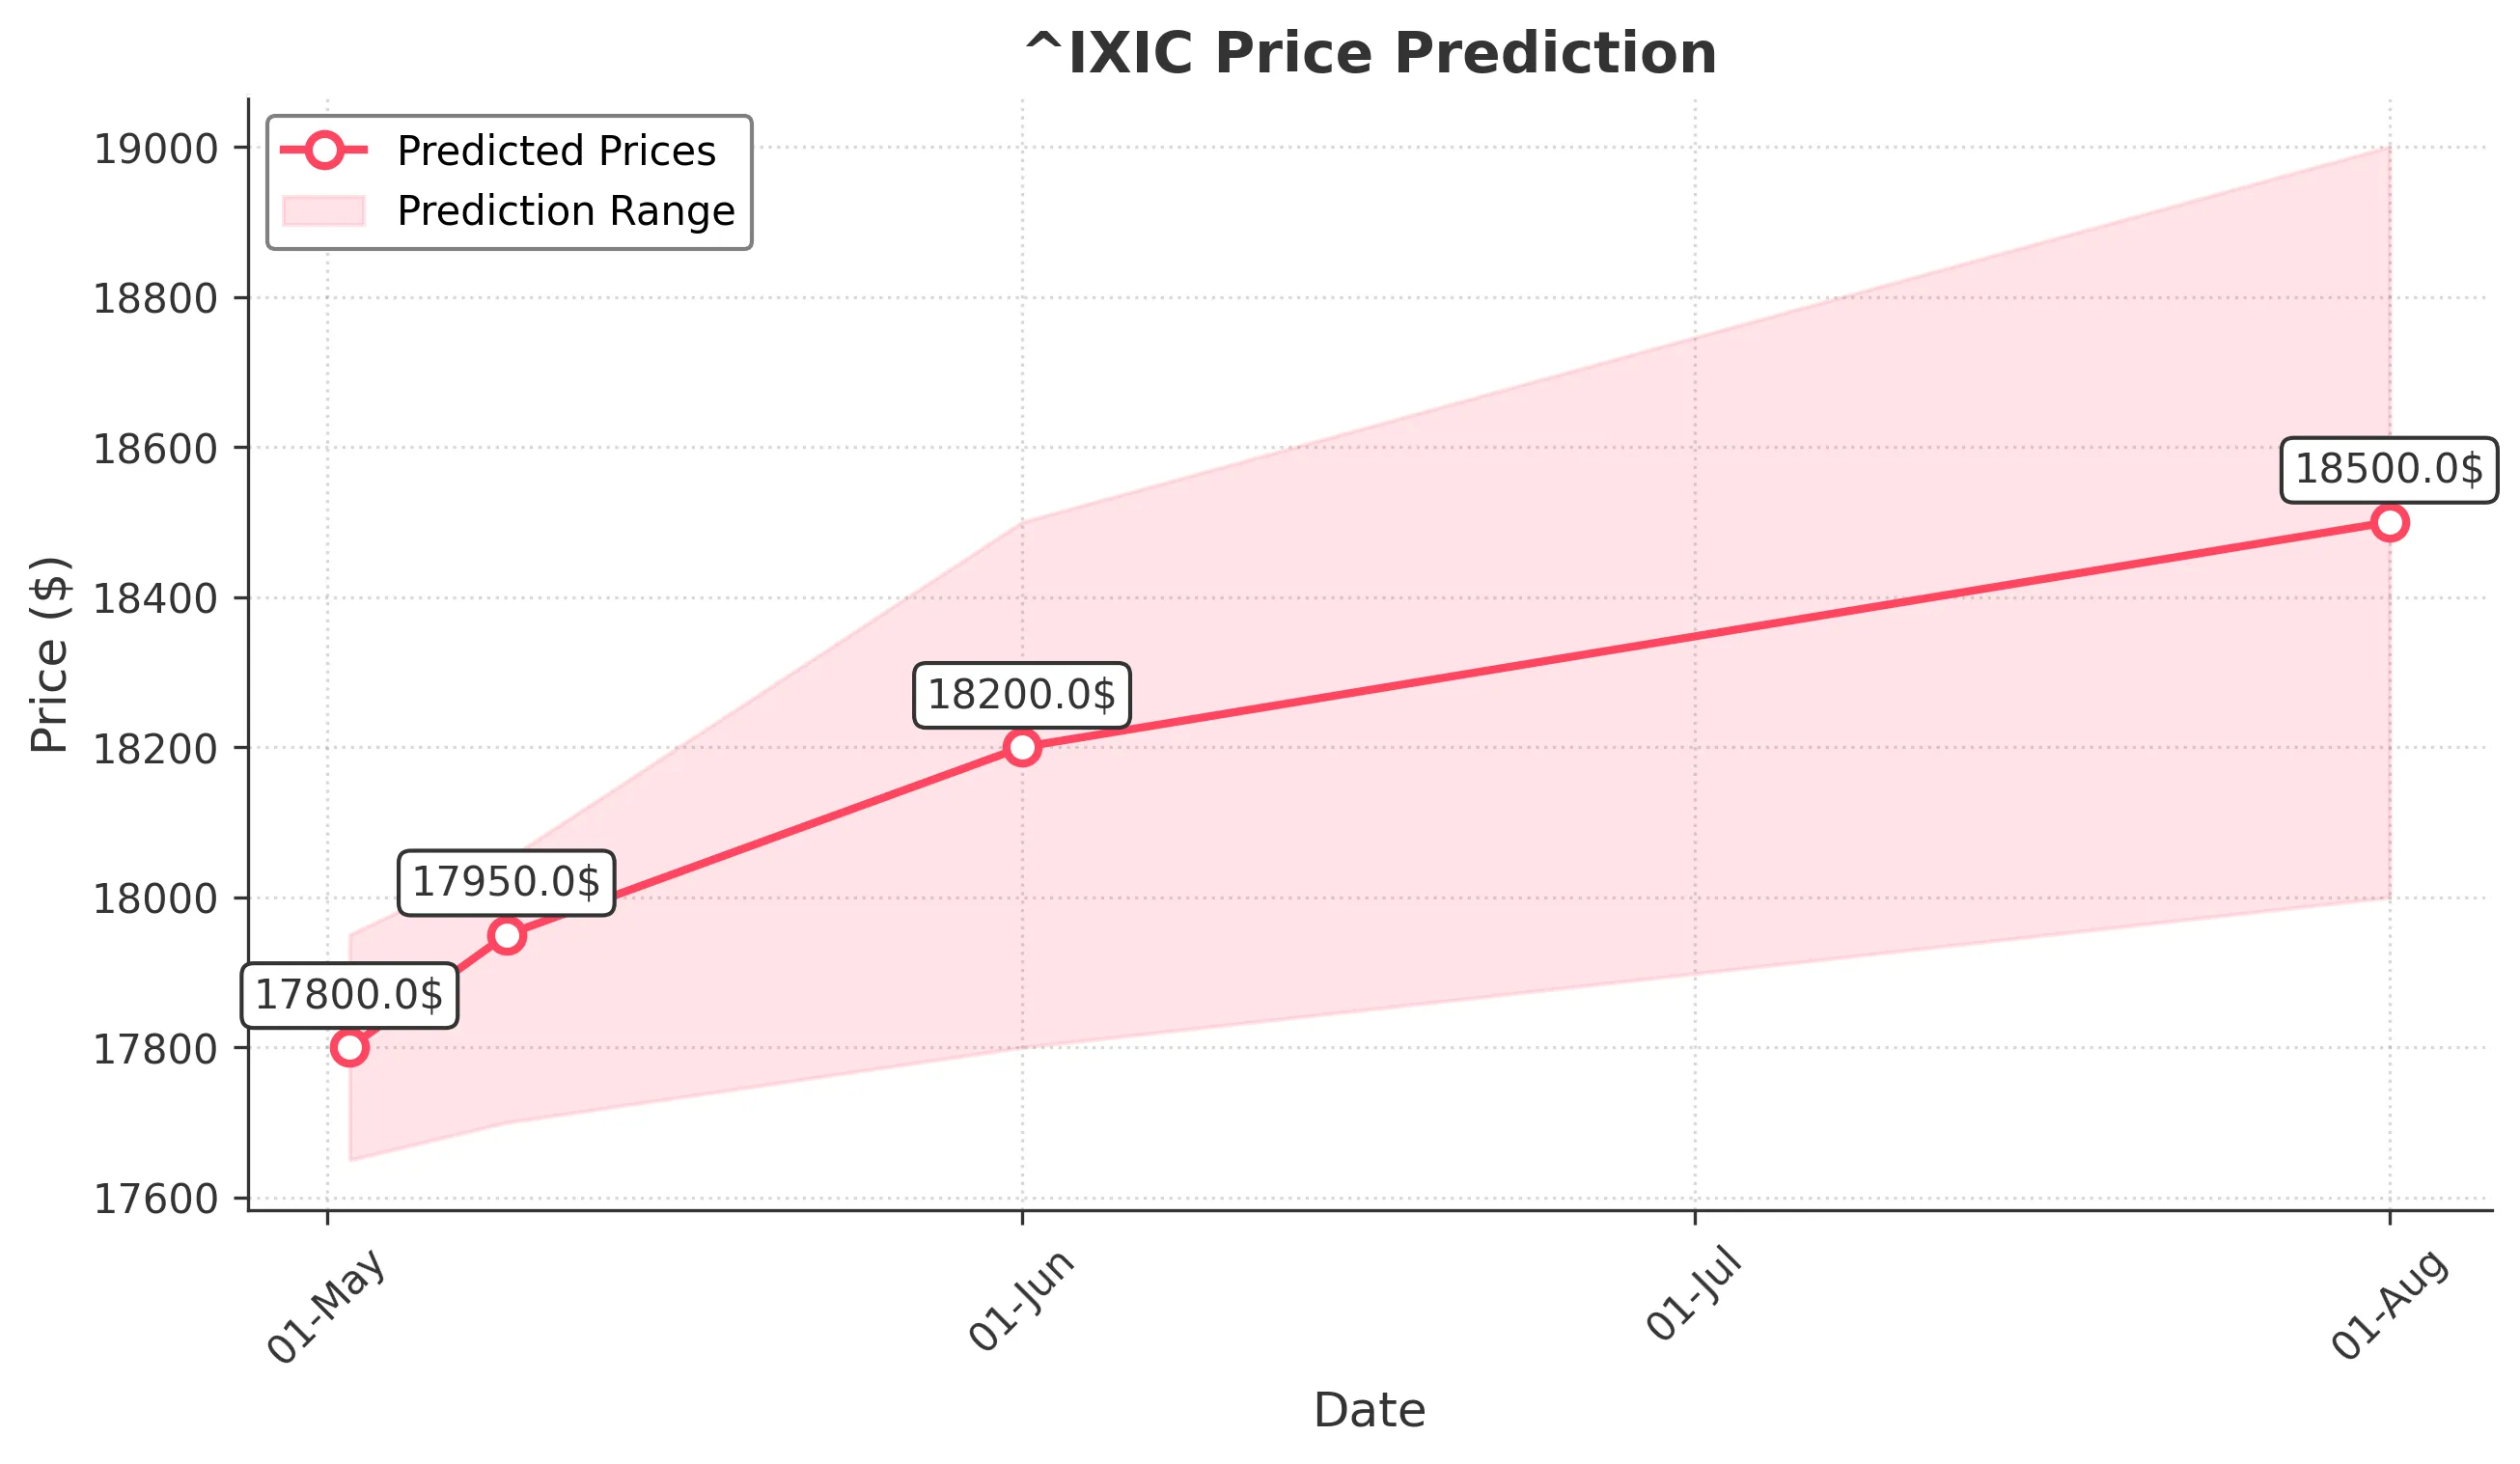
Target: May 2, 2025$17800
$17780
$17950
$17650
Description
The market shows a slight bullish trend with a recent upward movement. RSI indicates overbought conditions, suggesting a potential pullback. However, MACD remains positive, supporting a continuation of the upward trend. Volume is expected to be moderate.
Analysis
Over the past 3 months, ^IXIC has shown a bearish trend with significant volatility. Key support at 17000 and resistance at 18000. Recent candlestick patterns indicate indecision, while volume spikes suggest heightened trading activity. Macroeconomic factors may influence future movements.
Confidence Level
Potential Risks
Potential for a reversal exists due to overbought RSI levels and recent volatility.
1 Week Prediction
Target: May 9, 2025$17950
$17850
$18050
$17700
Description
The bullish momentum may continue into next week, supported by recent positive price action. However, the RSI indicates potential overbought conditions, which could lead to a pullback. Watch for volume trends to confirm strength.
Analysis
The past 3 months have seen significant fluctuations, with a bearish trend recently reversing. Key resistance at 18000 and support at 17000. Technical indicators show mixed signals, with MACD turning bullish but RSI nearing overbought territory.
Confidence Level
Potential Risks
Market sentiment could shift quickly due to external economic news or earnings reports.
1 Month Prediction
Target: June 1, 2025$18200
$18000
$18500
$17800
Description
Expect a gradual increase in price as bullish sentiment builds. The MACD is showing a positive divergence, and the price may test the 18500 resistance level. However, watch for potential corrections as the RSI approaches overbought levels.
Analysis
The index has been volatile, with a recent shift from bearish to bullish. Key support at 17000 and resistance at 18500. Volume patterns indicate increased interest, while technical indicators suggest a cautious bullish outlook.
Confidence Level
Potential Risks
Economic data releases could impact market sentiment and lead to volatility.
3 Months Prediction
Target: August 1, 2025$18500
$18200
$19000
$18000
Description
Long-term outlook remains cautiously optimistic, with potential for further gains. However, macroeconomic factors and earnings reports could introduce volatility. Watch for key support at 18000 and resistance at 19000.
Analysis
The past 3 months have shown a transition from bearish to bullish, with key levels established. The index is currently testing resistance levels, and while bullish momentum is present, external factors could influence future performance.
Confidence Level
Potential Risks
Unforeseen economic events or shifts in market sentiment could lead to significant price adjustments.