NSDQ Trading Predictions
1 Day Prediction
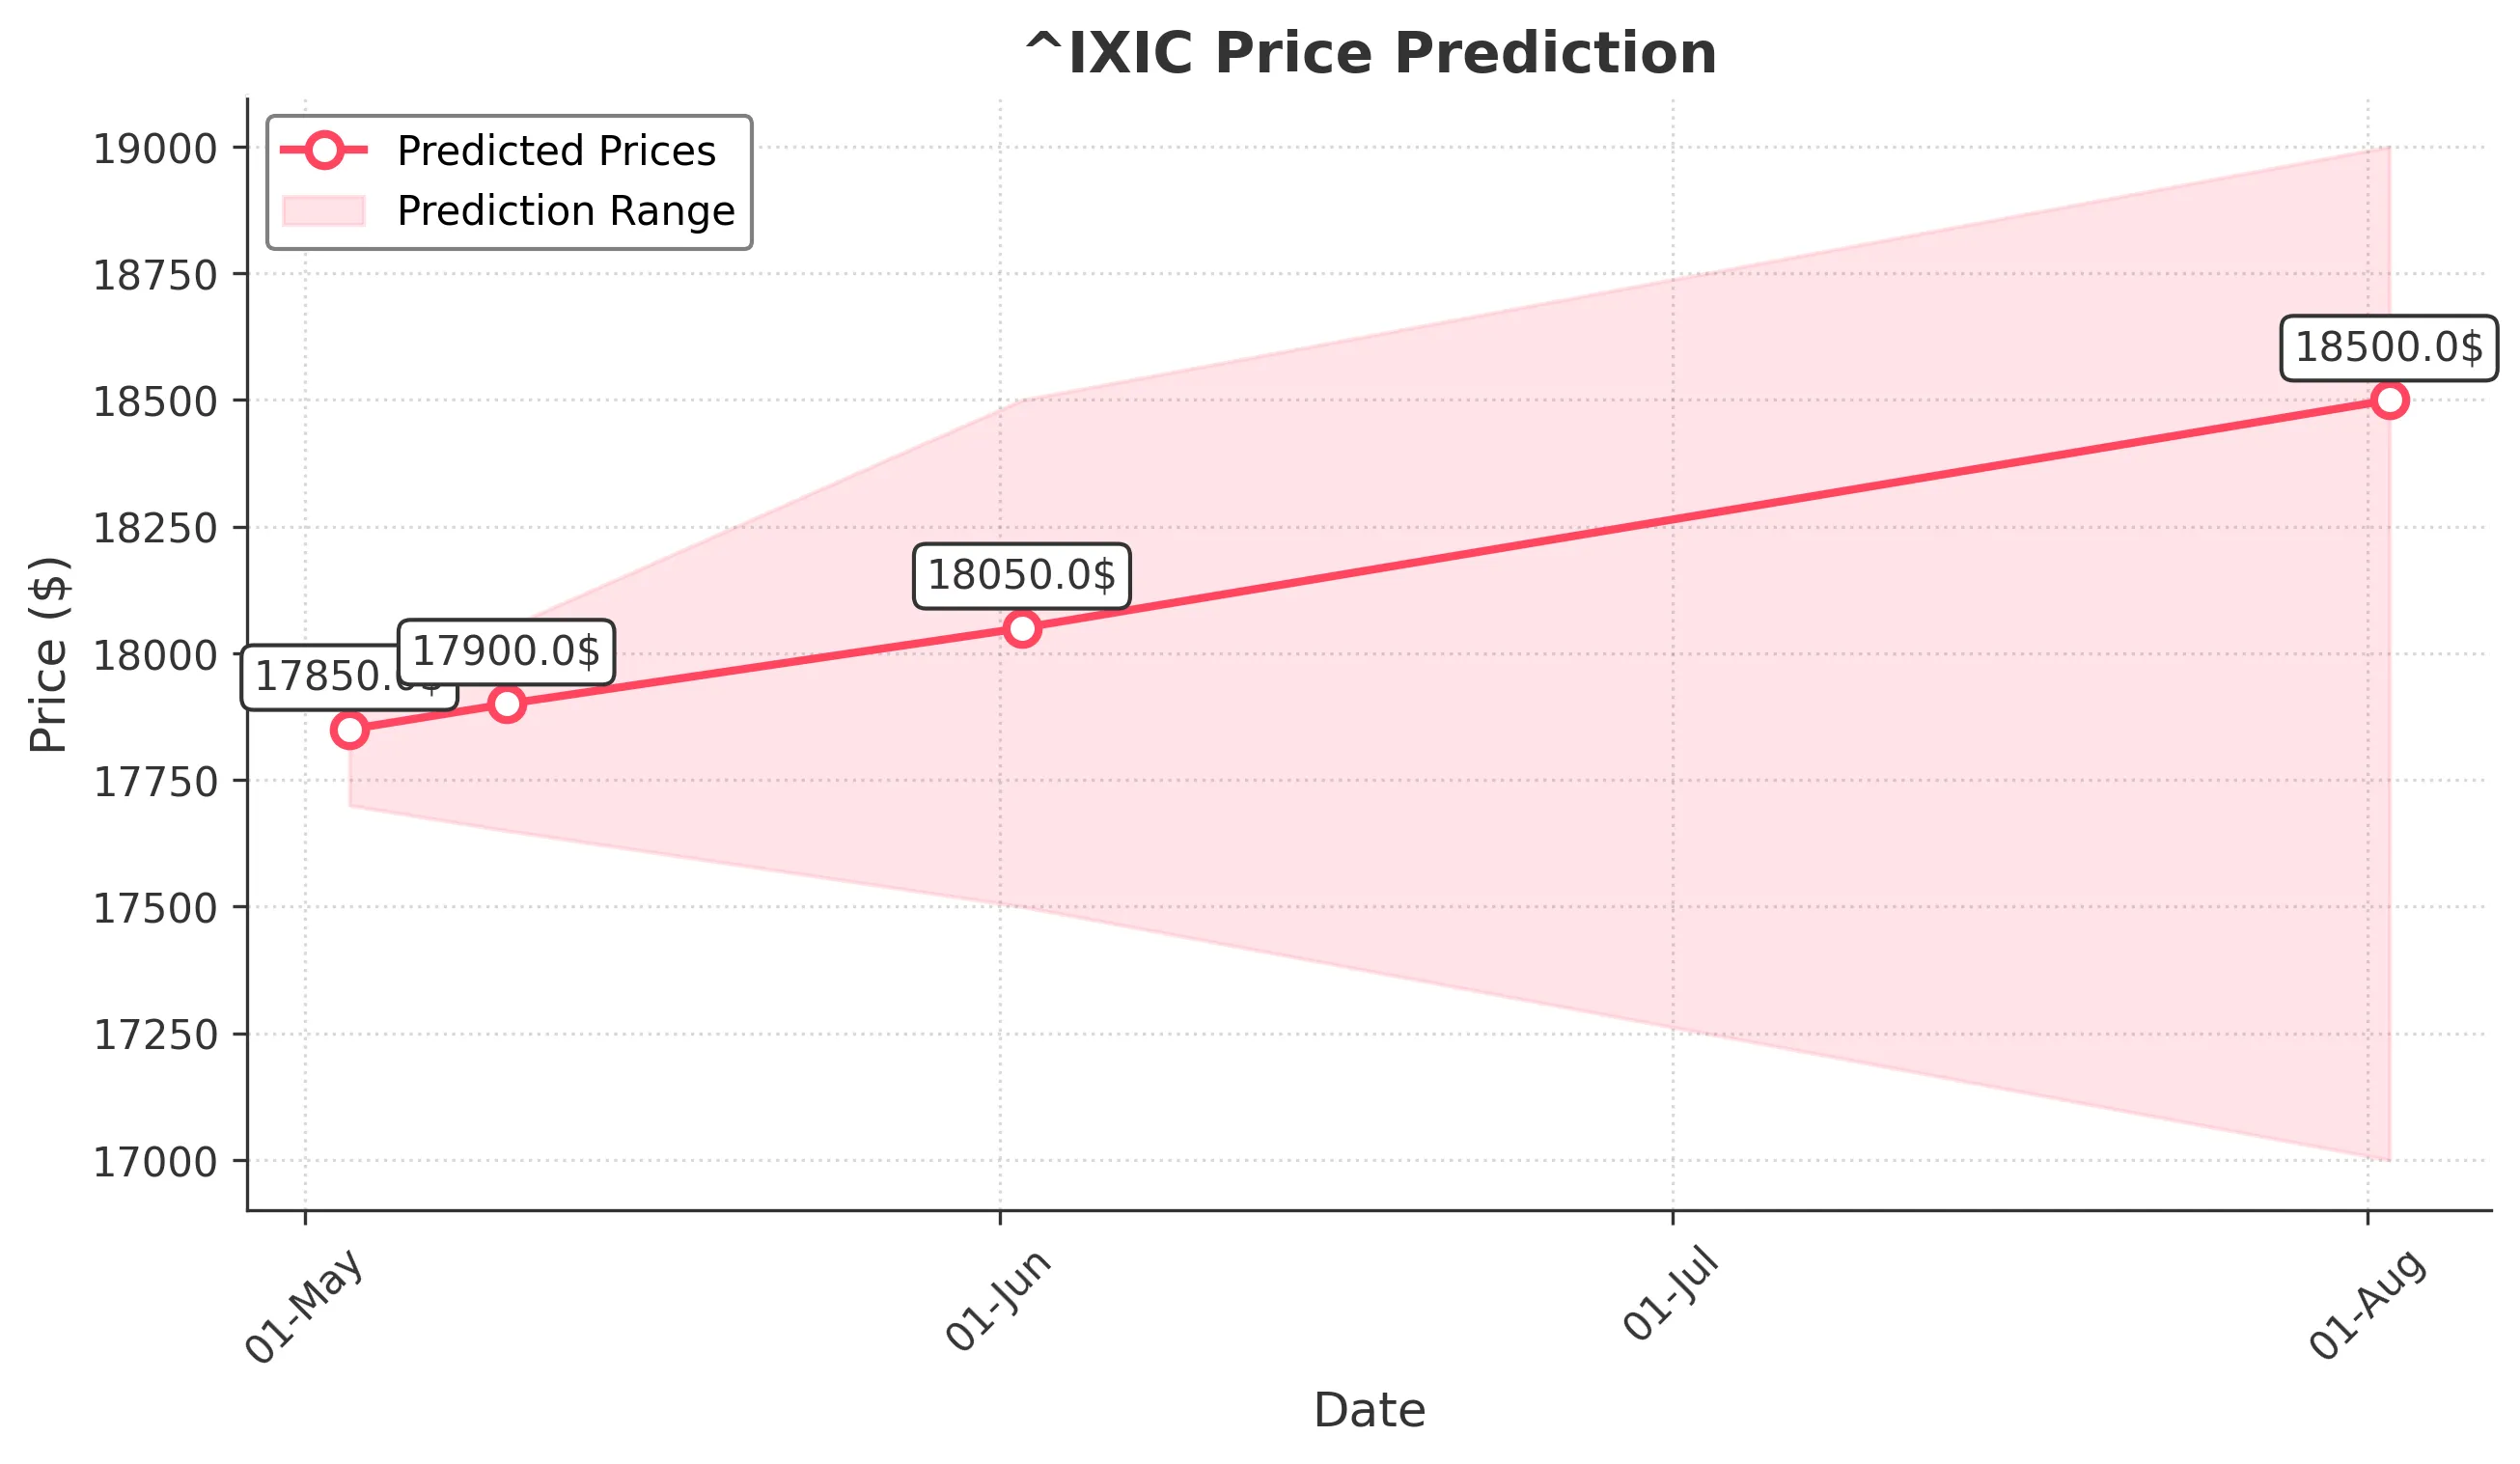
Target: May 3, 2025$17850
$17800
$17950
$17700
Description
The market shows a slight bullish trend with a recent upward movement. The RSI is approaching overbought levels, indicating potential resistance. A Doji pattern suggests indecision, but overall sentiment remains positive. Volume is expected to be high as traders react to recent gains.
Analysis
The past three months have shown a bearish trend with significant volatility. Key support at 17000 and resistance around 18000. Recent bullish signals from moving averages and a slight increase in volume suggest a possible short-term recovery, but caution is warranted.
Confidence Level
Potential Risks
Potential for a pullback exists if the market sentiment shifts or if macroeconomic news impacts trading.
1 Week Prediction
Target: May 10, 2025$17900
$17850
$18050
$17650
Description
The market is expected to maintain a bullish trend, supported by recent upward momentum. However, the RSI indicates overbought conditions, which may lead to a correction. Volume is likely to remain steady as traders assess market conditions.
Analysis
The stock has shown recovery signs after a significant drop. Key resistance at 18000 may limit upward movement. The MACD indicates a bullish crossover, but caution is advised due to potential overextension in price.
Confidence Level
Potential Risks
Market volatility and external economic factors could lead to unexpected price movements.
1 Month Prediction
Target: June 2, 2025$18050
$17900
$18500
$17500
Description
The market is likely to stabilize around current levels with potential for gradual gains. The Bollinger Bands indicate a tightening range, suggesting lower volatility. However, macroeconomic factors could influence market sentiment.
Analysis
The stock has been in a recovery phase, but the overall trend remains uncertain. Key support at 17500 and resistance at 18500. The ATR indicates moderate volatility, and the market sentiment is mixed, reflecting uncertainty.
Confidence Level
Potential Risks
Economic data releases and geopolitical events could impact market direction significantly.
3 Months Prediction
Target: August 2, 2025$18500
$18200
$19000
$17000
Description
Long-term outlook suggests a potential recovery towards 18500, driven by improving economic indicators. However, the market remains sensitive to external shocks. The Fibonacci retracement levels indicate potential resistance at 19000.
Analysis
The stock has experienced high volatility with a bearish trend in the past months. Key resistance at 19000 and support at 17000. The market sentiment is cautious, and external economic factors will play a crucial role in future price movements.
Confidence Level
Potential Risks
Unforeseen economic events or shifts in market sentiment could lead to significant deviations from this prediction.