NSDQ Trading Predictions
1 Day Prediction
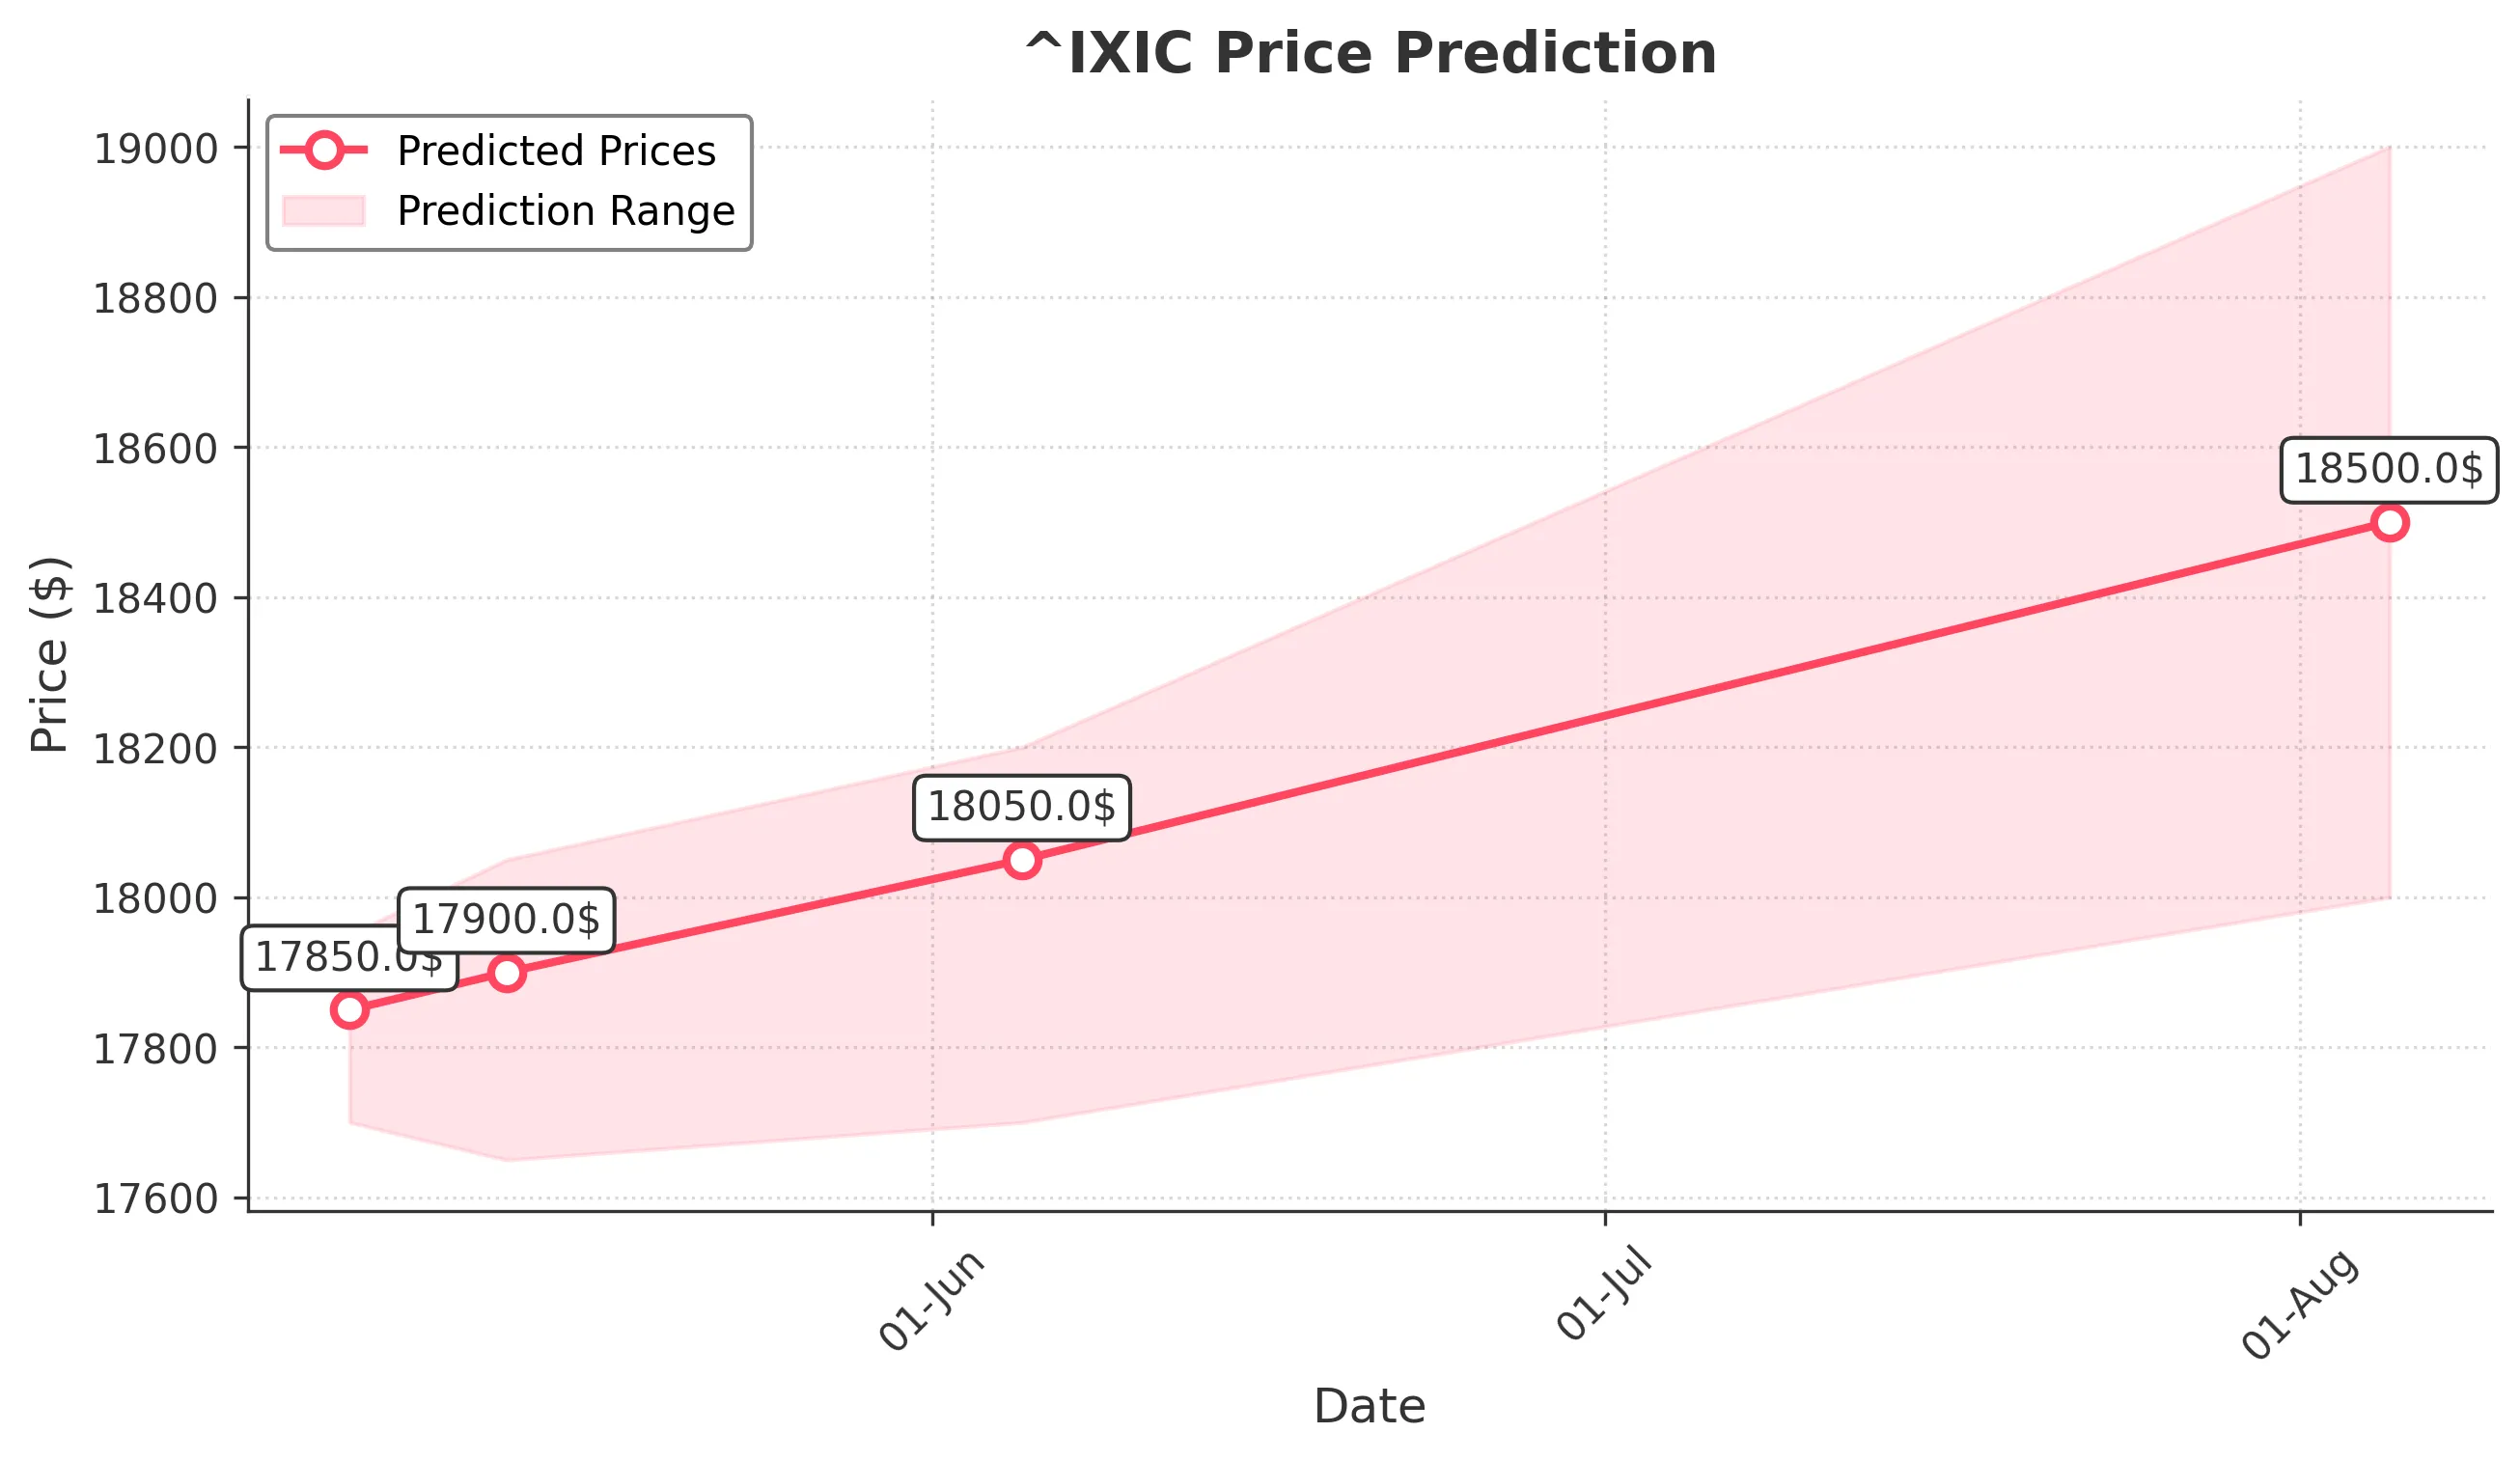
Target: May 6, 2025$17850
$17800
$17950
$17700
Description
The market shows signs of stabilization after recent volatility. RSI indicates oversold conditions, suggesting a potential bounce. However, MACD remains bearish, indicating caution. Volume spikes may indicate increased interest, but external factors could still impact prices.
Analysis
Over the past 3 months, ^IXIC has experienced significant fluctuations, with a bearish trend recently. Key support at 17,000 has held, but resistance at 18,000 remains strong. Technical indicators show mixed signals, with RSI suggesting oversold conditions, while MACD indicates bearish momentum. Volume patterns show spikes during sell-offs, indicating heightened activity. Overall, the outlook is cautiously optimistic, but risks remain.
Confidence Level
Potential Risks
Market sentiment is fragile, and any negative news could reverse the trend. The recent high volatility raises concerns about sustainability.
1 Week Prediction
Target: May 13, 2025$17900
$17850
$18050
$17650
Description
A slight upward trend is expected as the market digests recent losses. The 50-day moving average is approaching the current price, which may provide support. However, MACD remains negative, indicating potential resistance at higher levels.
Analysis
The past three months have shown a bearish trend with significant volatility. Support levels around 17,000 have been tested, while resistance at 18,000 remains a challenge. Technical indicators like Bollinger Bands suggest potential for a rebound, but caution is warranted due to overall market sentiment and external economic factors.
Confidence Level
Potential Risks
Potential for market corrections exists, especially if macroeconomic data disappoints or geopolitical tensions escalate.
1 Month Prediction
Target: June 5, 2025$18050
$17900
$18200
$17700
Description
Expect a gradual recovery as the market stabilizes. The RSI is moving towards neutral territory, indicating less selling pressure. However, the MACD remains bearish, suggesting caution. Volume may increase as investors look for entry points.
Analysis
The stock has been in a bearish phase, with significant price swings. Key support at 17,000 has been tested multiple times, while resistance at 18,000 remains a barrier. Technical indicators show mixed signals, with potential for recovery but also risks of further declines. Market sentiment is cautious, influenced by macroeconomic conditions.
Confidence Level
Potential Risks
Economic indicators and earnings reports could sway market sentiment, leading to unexpected volatility.
3 Months Prediction
Target: August 5, 2025$18500
$18200
$19000
$18000
Description
A more bullish outlook is anticipated as the market adjusts to economic conditions. If key resistance levels are broken, a rally could ensue. However, macroeconomic uncertainties could still pose risks.
Analysis
The overall trend has been bearish, but signs of recovery are emerging. Key support levels are holding, and if the market can break through resistance at 18,000, a bullish trend may develop. Technical indicators suggest potential for upward movement, but external factors remain a significant risk.
Confidence Level
Potential Risks
Unforeseen economic events or shifts in market sentiment could lead to volatility, impacting the accuracy of this prediction.