NSDQ Trading Predictions
1 Day Prediction
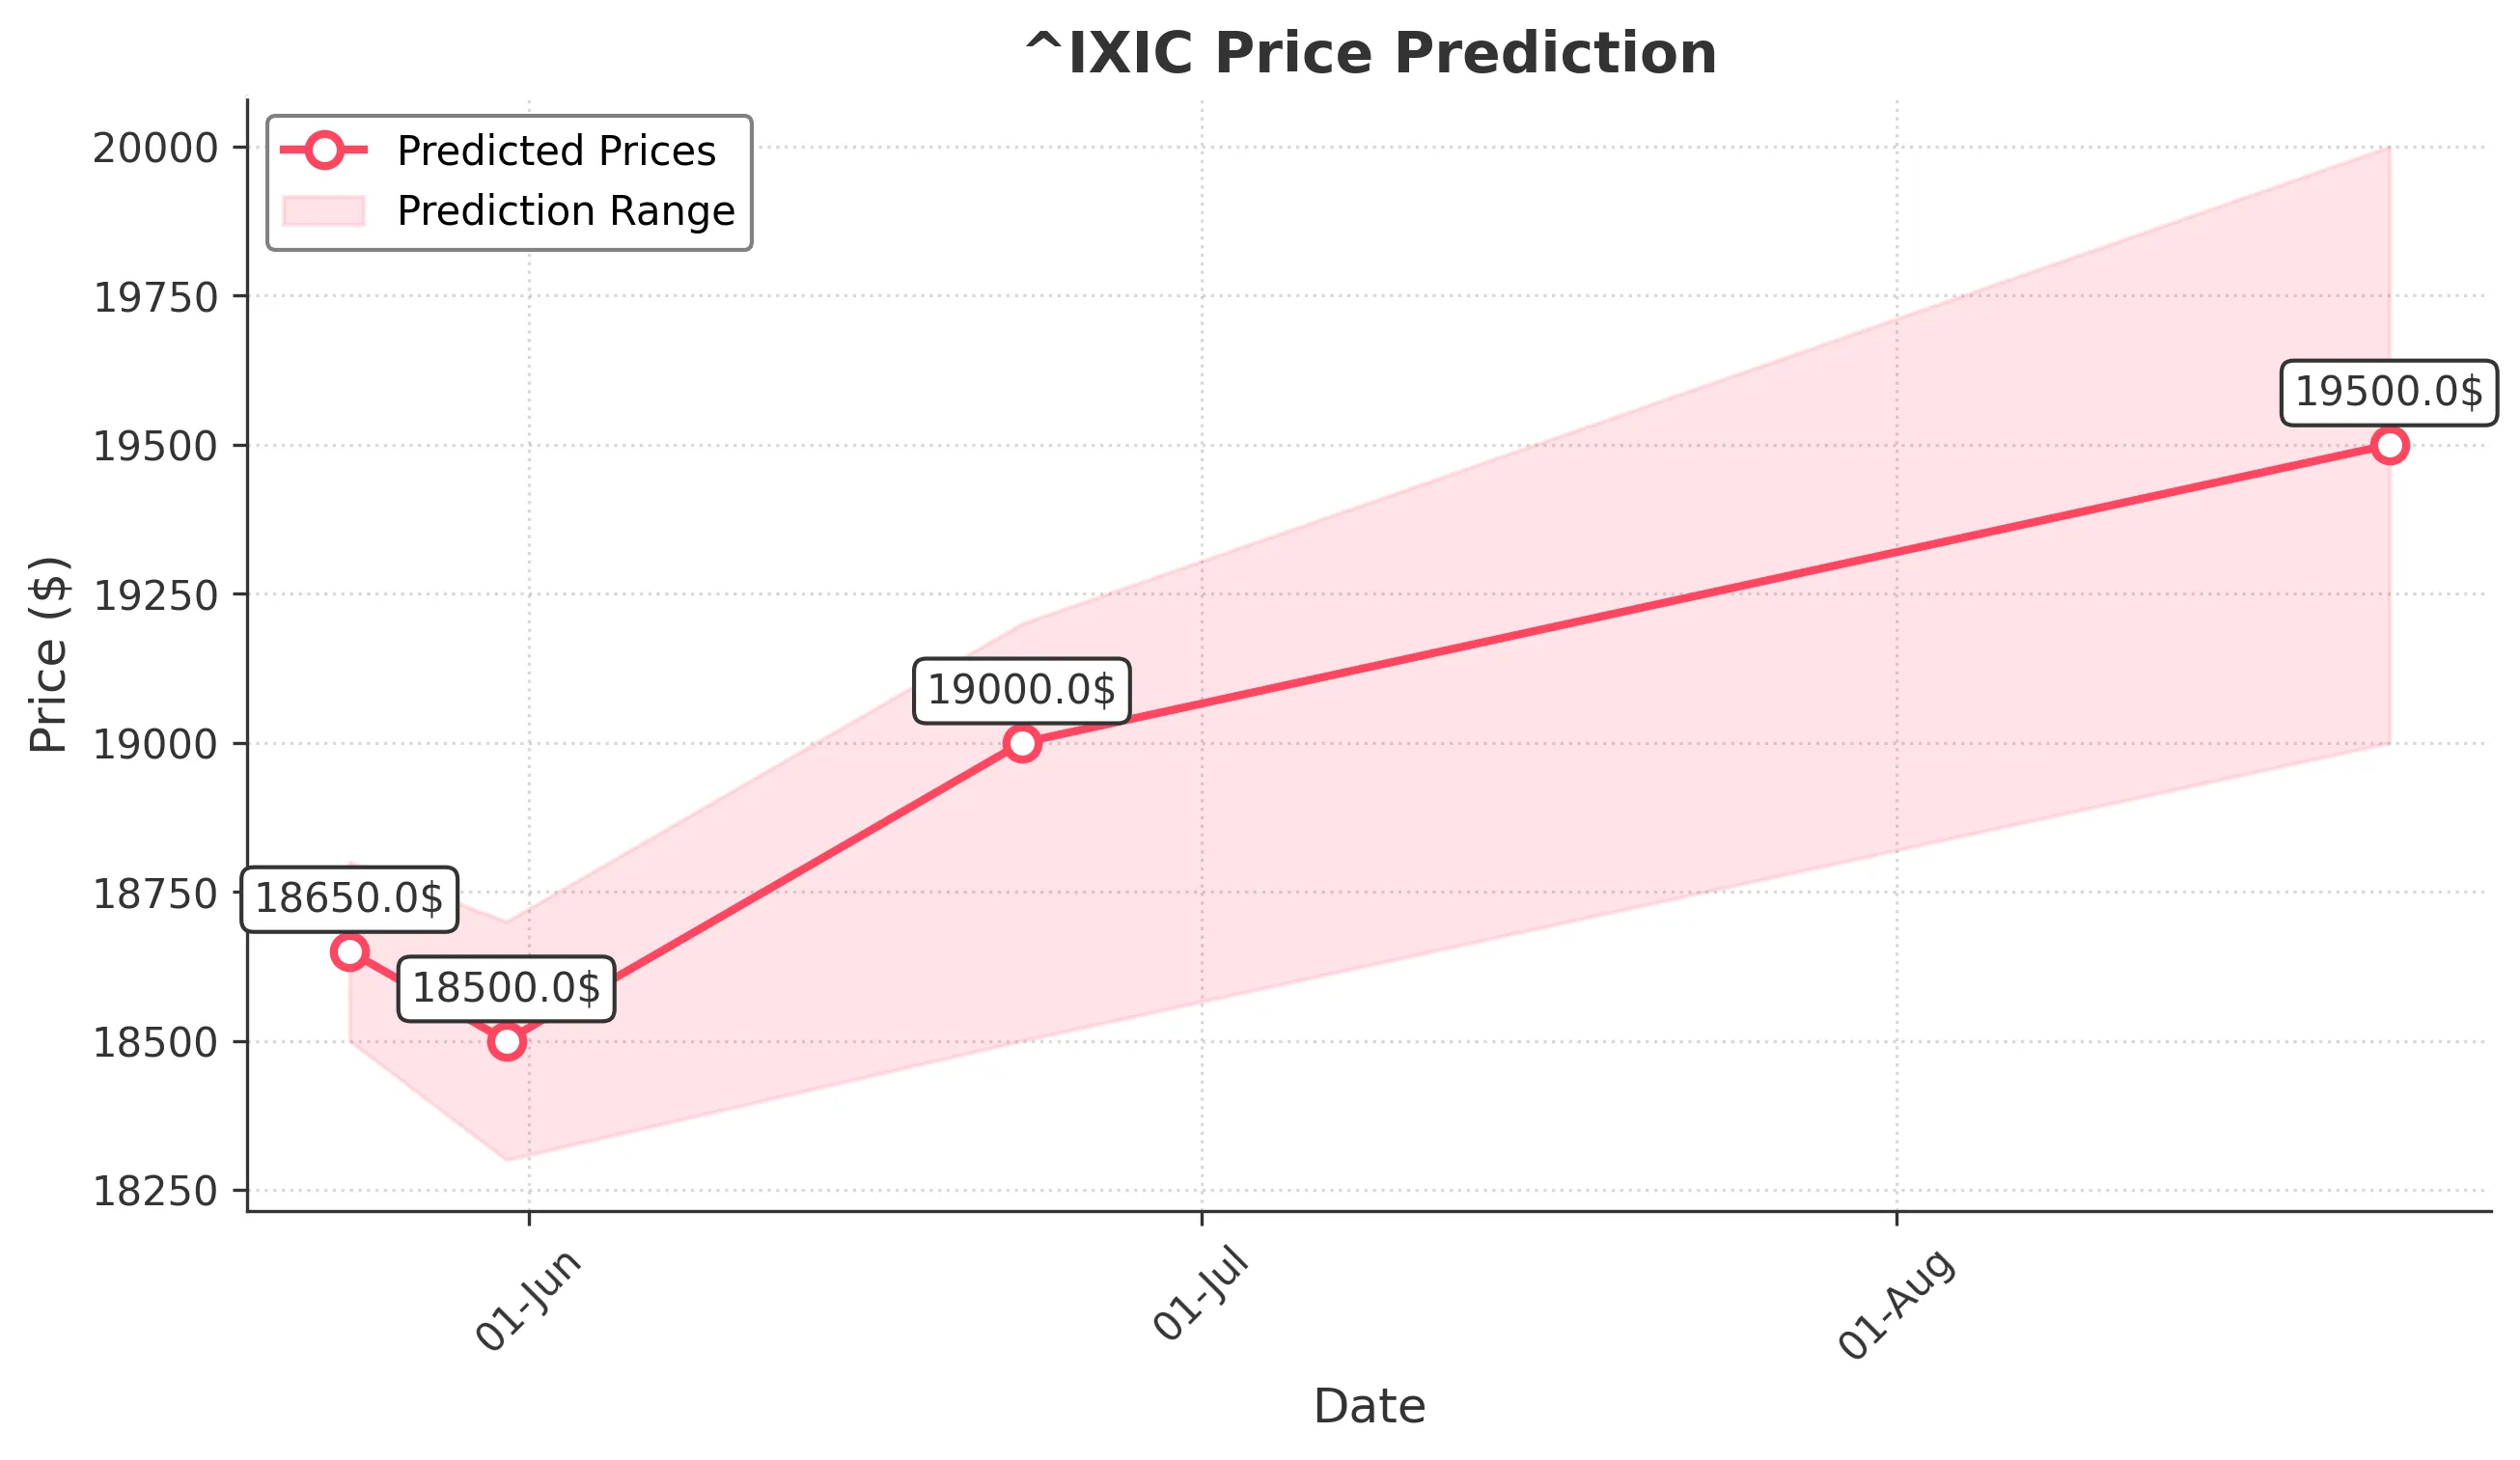
Target: May 24, 2025$18650
$18700
$18800
$18500
Description
The market shows bearish momentum with a recent downtrend. RSI indicates oversold conditions, but MACD suggests potential for a slight recovery. Volume spikes indicate selling pressure. Expect a close around 18650.
Analysis
The past 3 months show a bearish trend with significant resistance at 19000. Recent candlestick patterns indicate indecision, and volume analysis shows increased selling. The market sentiment is cautious, influenced by macroeconomic factors.
Confidence Level
Potential Risks
Market volatility and external news could impact this prediction significantly.
1 Week Prediction
Target: May 31, 2025$18500
$18600
$18700
$18300
Description
The bearish trend is expected to continue, with potential support at 18300. Technical indicators suggest a lack of bullish momentum. Volume remains high, indicating ongoing selling pressure.
Analysis
The stock has been in a downtrend, with key support at 18300. The RSI is approaching oversold levels, but MACD remains bearish. Volume patterns indicate strong selling, and market sentiment is cautious.
Confidence Level
Potential Risks
Unexpected market news or economic data releases could alter this outlook.
1 Month Prediction
Target: June 23, 2025$19000
$18800
$19200
$18500
Description
A potential recovery is anticipated as the market may find support at 18500. Technical indicators suggest a possible reversal, with bullish divergence in RSI. Volume may stabilize as sentiment improves.
Analysis
The stock has shown signs of stabilization after a prolonged downtrend. Key support at 18500 may hold, and if it does, a recovery towards 19000 is plausible. However, market sentiment remains fragile.
Confidence Level
Potential Risks
Market conditions are volatile, and external factors could hinder recovery.
3 Months Prediction
Target: August 23, 2025$19500
$19300
$20000
$19000
Description
If the market stabilizes, a gradual recovery towards 19500 is possible. Technical indicators may show bullish signals if support levels hold. However, macroeconomic factors could still pose risks.
Analysis
The stock's performance over the last three months has been bearish, with significant resistance at 20000. If the market sentiment shifts positively, a recovery could occur, but risks remain high due to external factors.
Confidence Level
Potential Risks
Economic uncertainties and potential market corrections could impact this forecast.