NSDQ Trading Predictions
1 Day Prediction
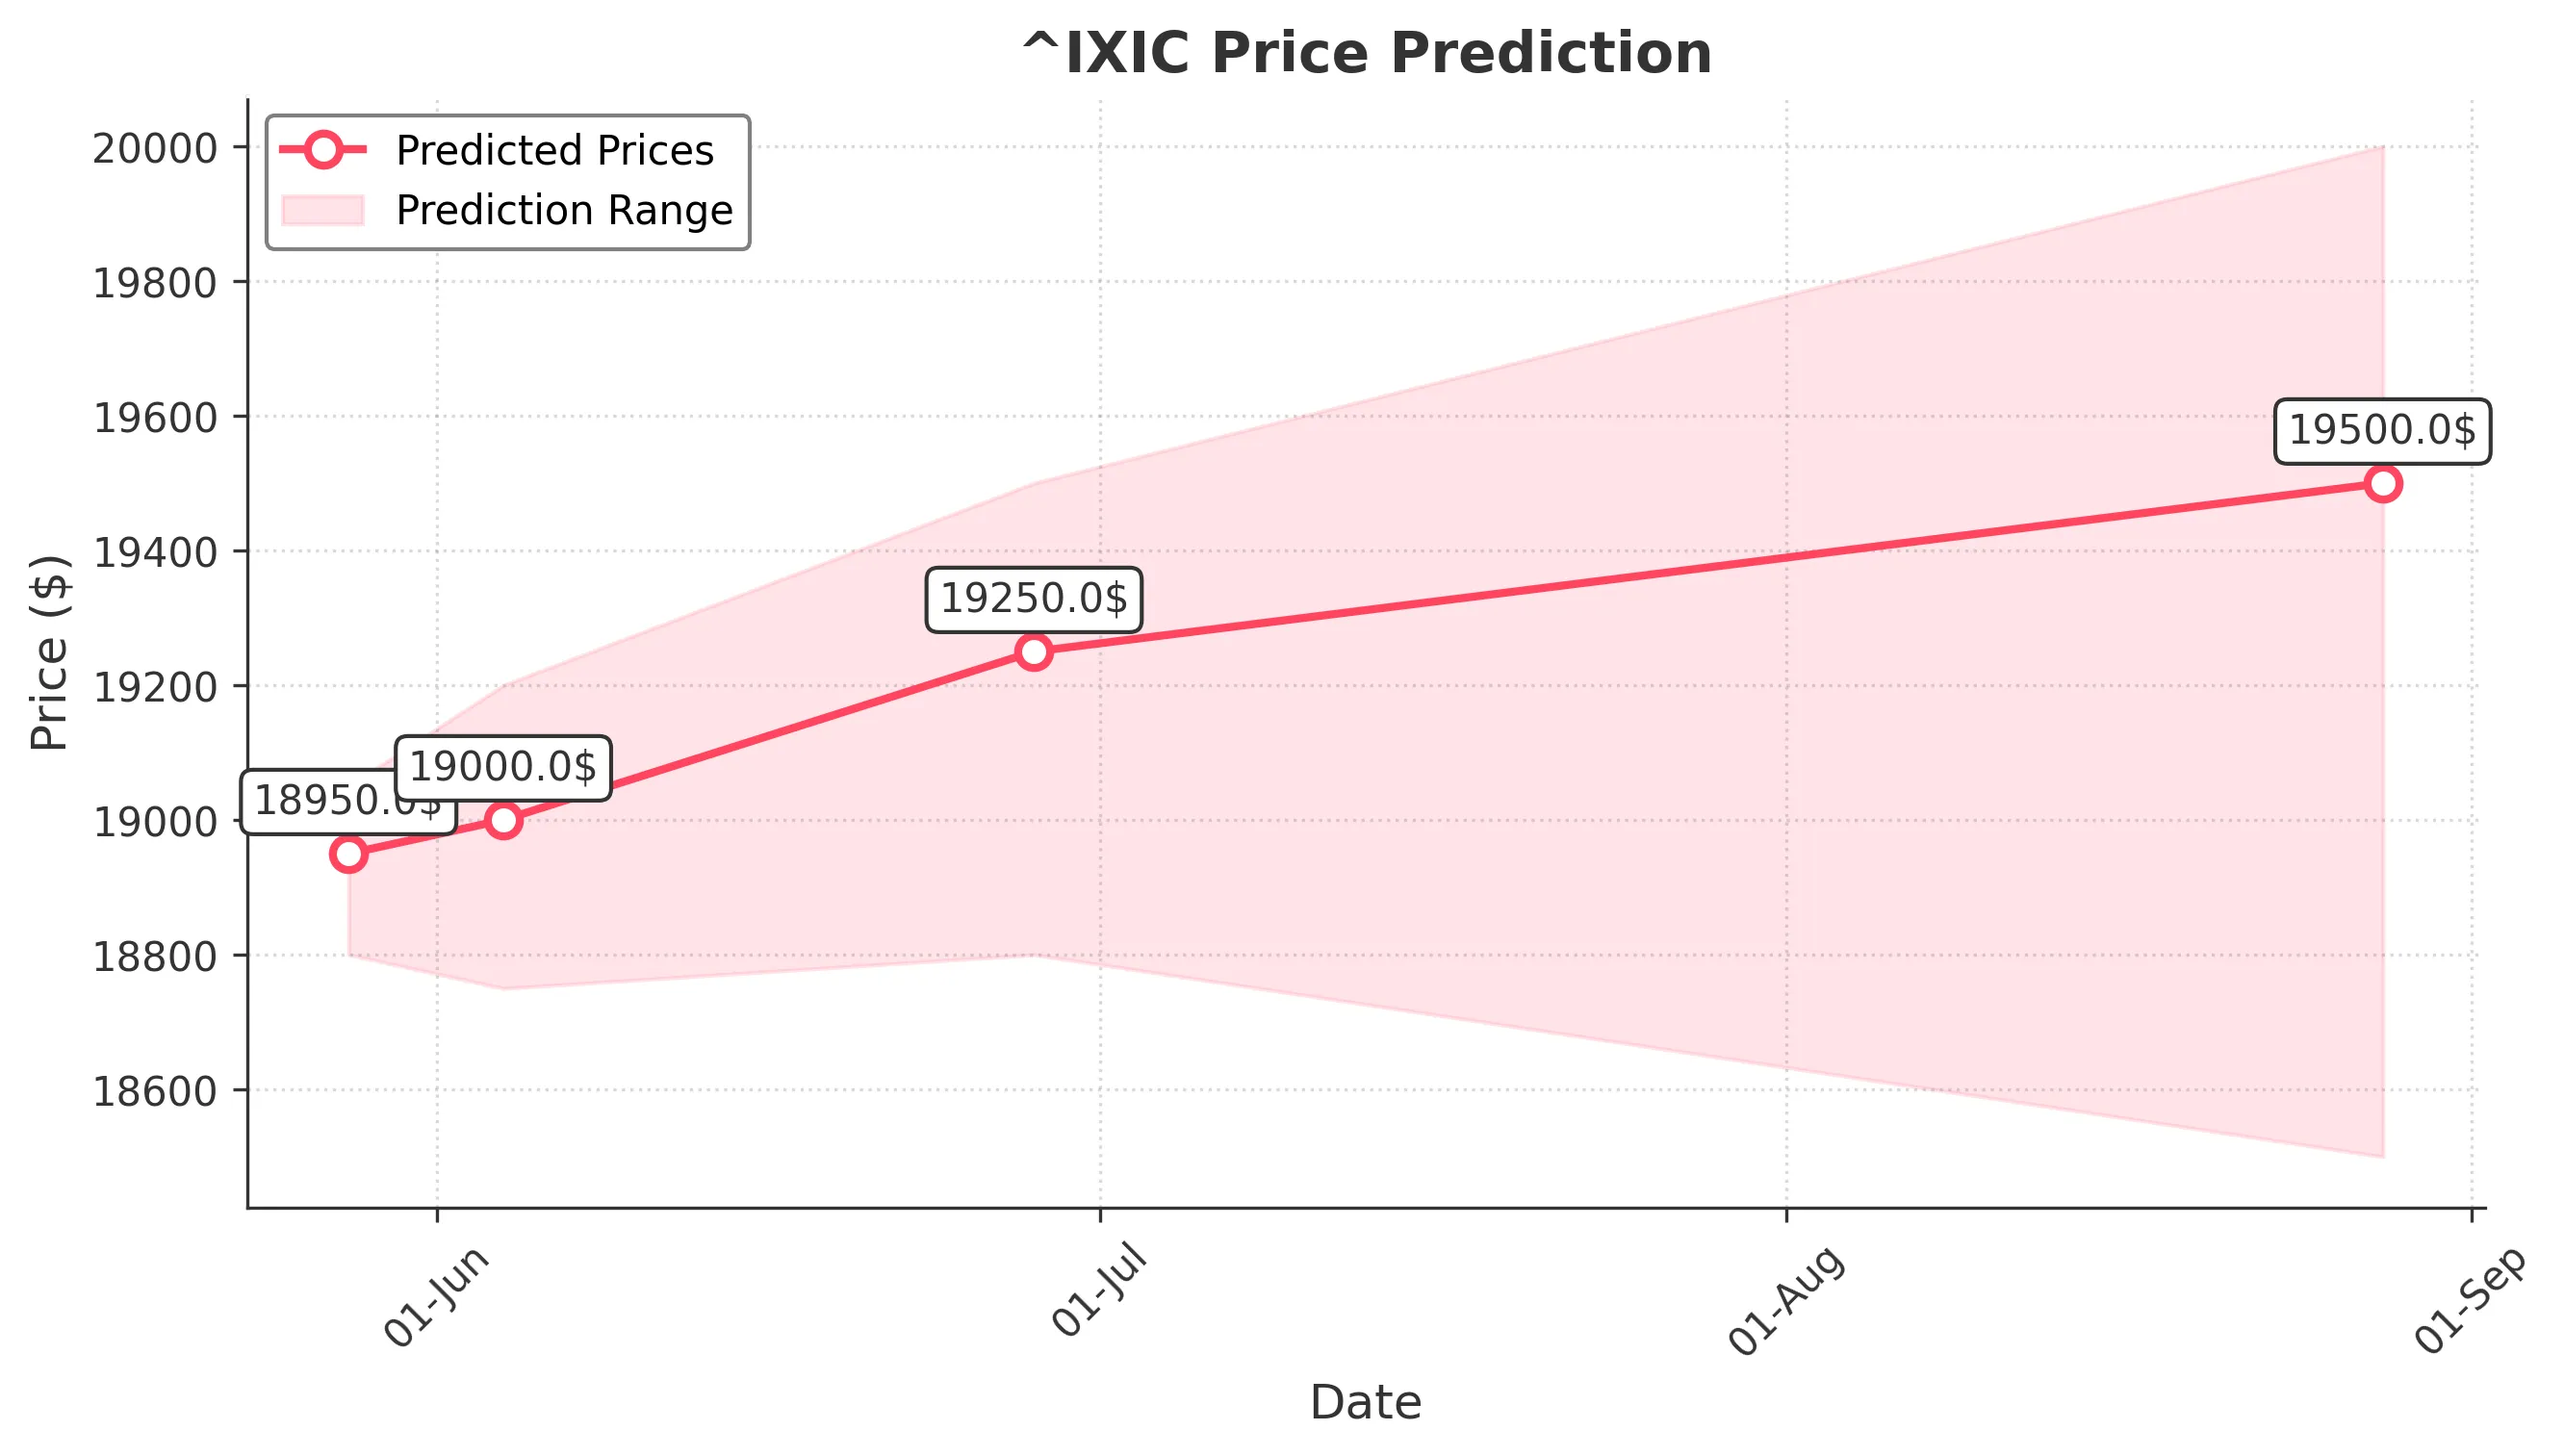
Target: May 28, 2025$18950
$18900
$19050
$18800
Description
The market shows bullish momentum with a recent upward trend. The RSI is approaching overbought levels, indicating potential for a pullback. However, strong volume suggests continued interest. Watch for resistance at 19000.
Analysis
The past 3 months show a bullish trend with significant support at 18500 and resistance around 19000. Recent volume spikes indicate strong buying interest. However, volatility remains high, and external factors could impact sentiment.
Confidence Level
Potential Risks
Potential for a pullback due to overbought RSI. Market sentiment may shift quickly.
1 Week Prediction
Target: June 4, 2025$19000
$18950
$19200
$18750
Description
Expect a slight increase as bullish sentiment persists. The MACD shows a bullish crossover, and the price is above the 50-day moving average. However, watch for potential resistance at 19200.
Analysis
The stock has shown resilience with a bullish trend. Key support at 18500 and resistance at 19200. The MACD and moving averages indicate upward momentum, but caution is advised due to potential market corrections.
Confidence Level
Potential Risks
Market volatility and external economic news could affect the prediction.
1 Month Prediction
Target: June 28, 2025$19250
$19000
$19500
$18800
Description
The bullish trend is expected to continue, supported by strong fundamentals and positive market sentiment. The Fibonacci retracement levels suggest a target around 19250, with potential resistance at 19500.
Analysis
The stock has been on an upward trajectory, with strong support at 18500. The RSI indicates bullish momentum, but caution is warranted as the market approaches overbought conditions. External factors may influence future performance.
Confidence Level
Potential Risks
Economic indicators and geopolitical events could introduce volatility.
3 Months Prediction
Target: August 28, 2025$19500
$19200
$20000
$18500
Description
Long-term bullish outlook as the market stabilizes. The 200-day moving average supports upward momentum. However, potential resistance at 20000 may lead to profit-taking.
Analysis
The stock has shown a strong bullish trend with key support at 18500 and resistance at 20000. The MACD and moving averages indicate continued upward momentum, but external economic factors could introduce volatility.
Confidence Level
Potential Risks
Market corrections and economic shifts could impact the forecast.