NSDQ Trading Predictions
1 Day Prediction
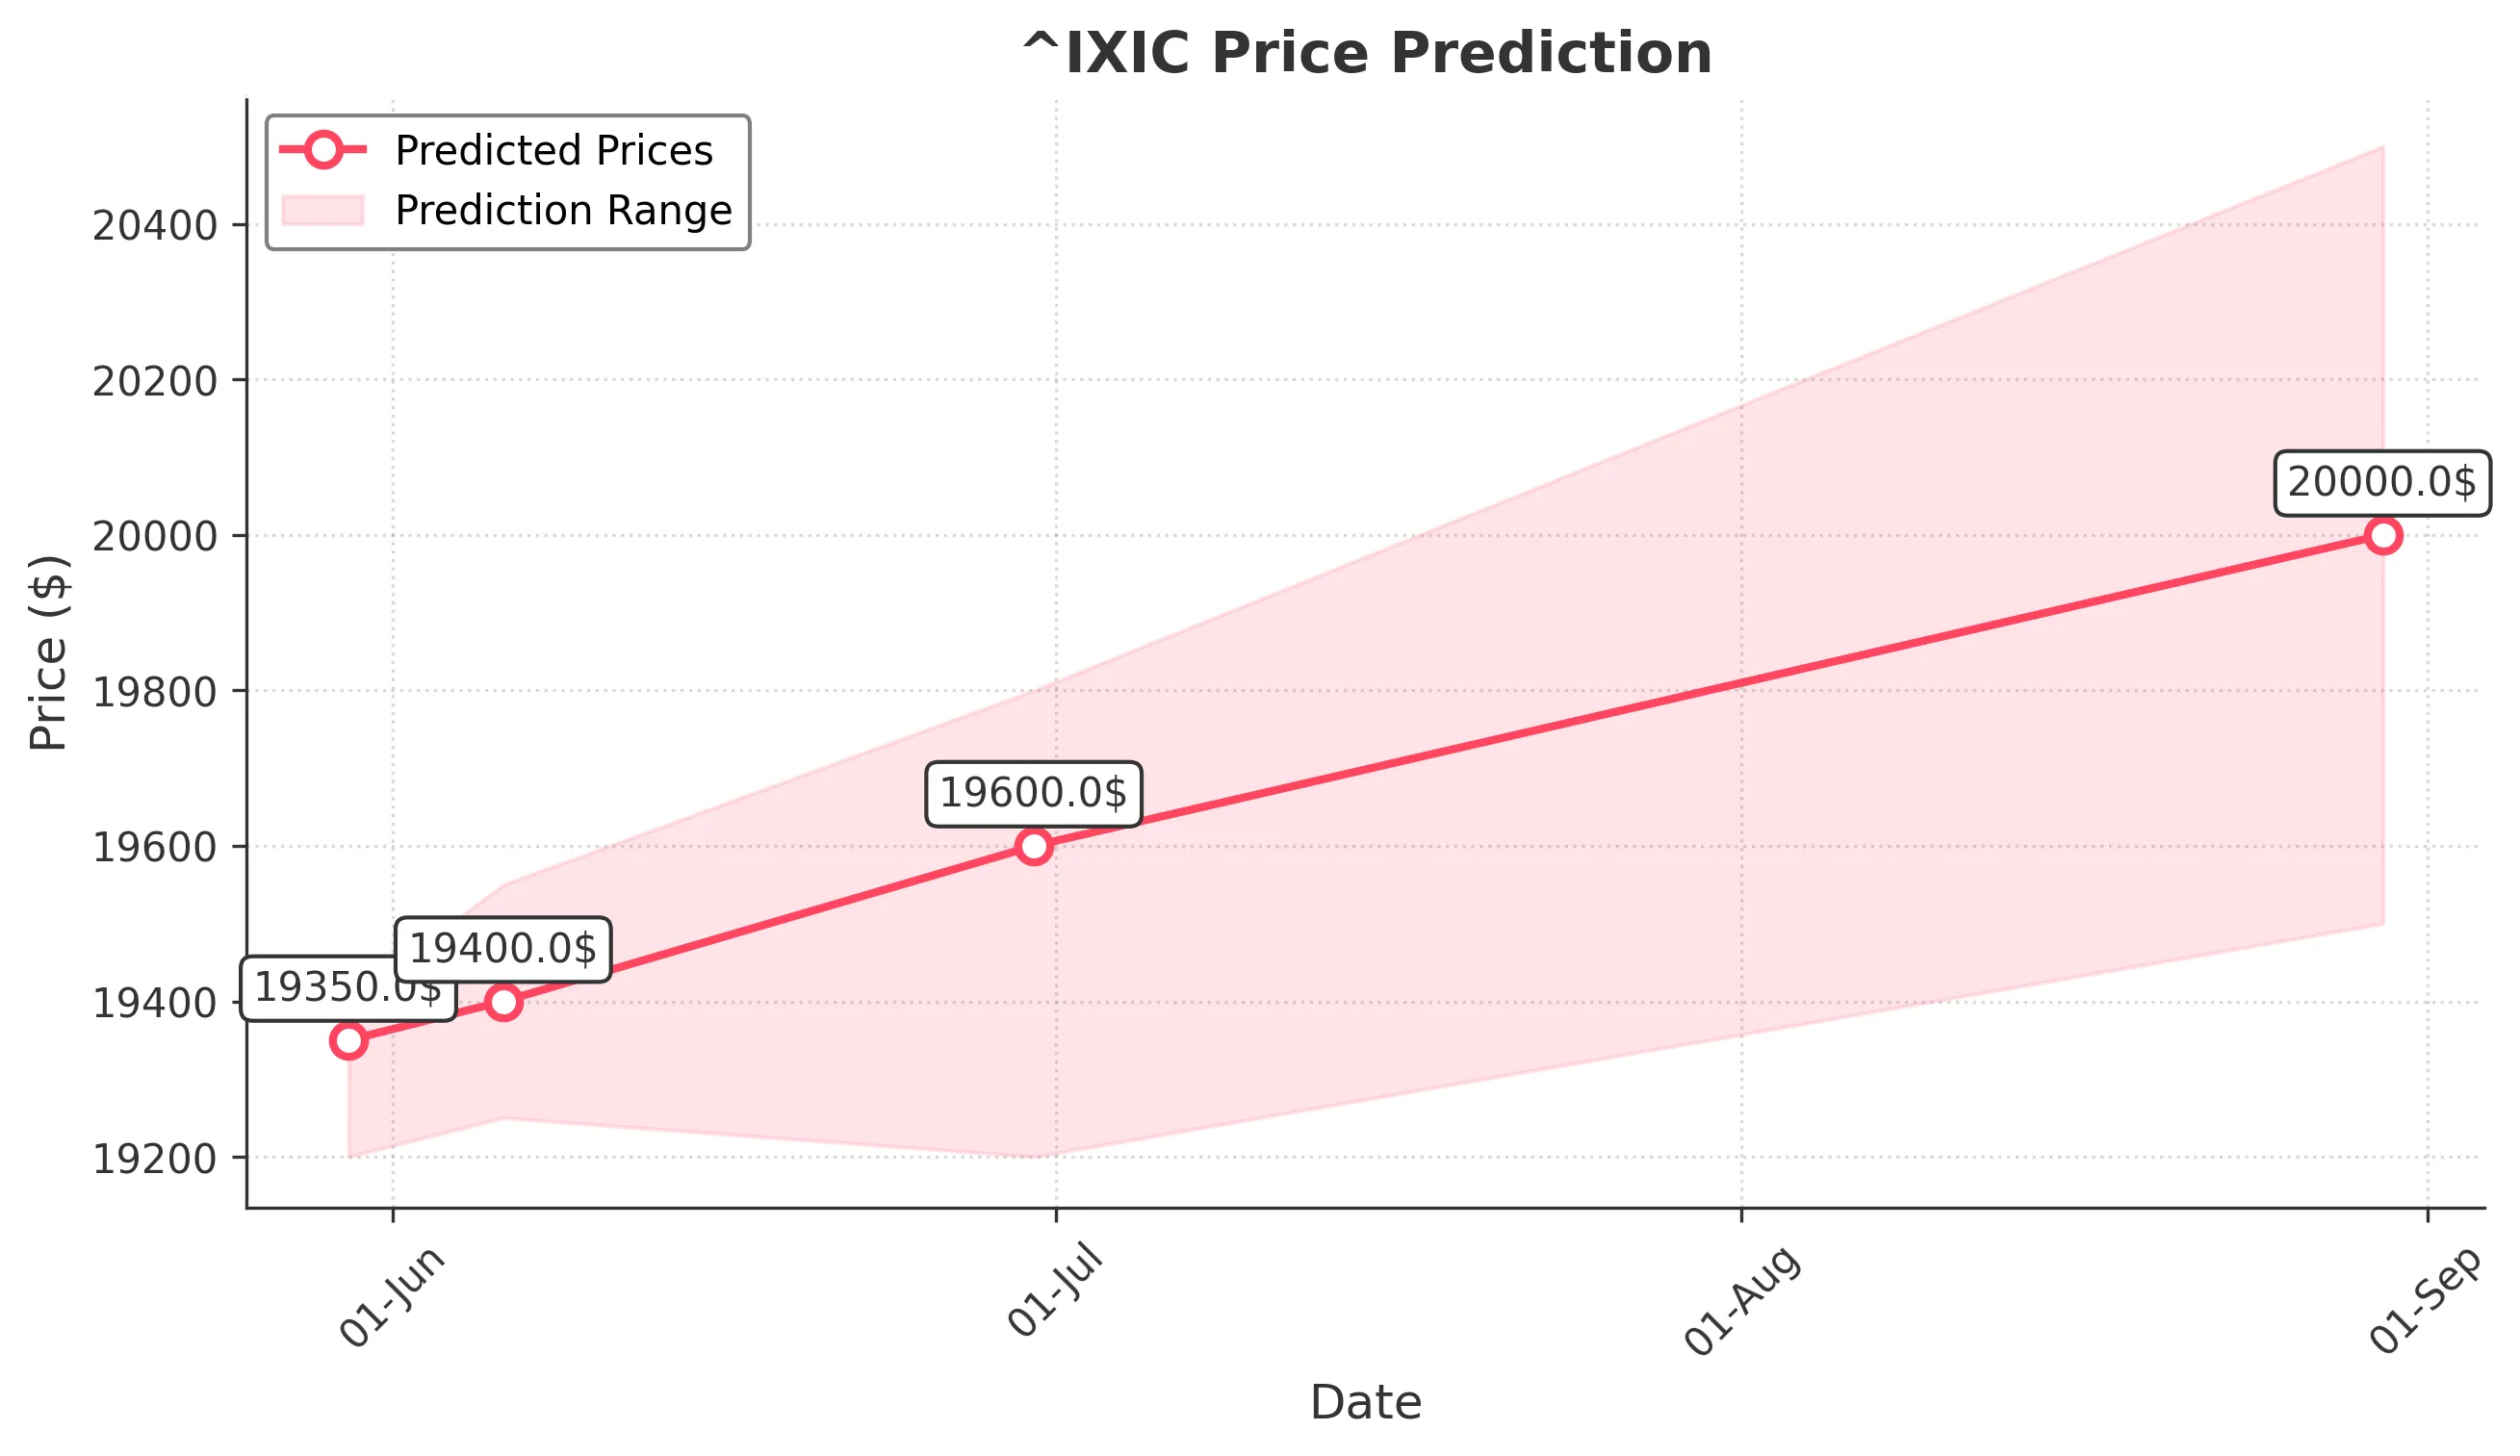
Target: May 30, 2025$19350
$19300
$19400
$19200
Description
The recent bullish momentum, supported by a strong close and positive RSI, suggests a continuation of upward movement. The MACD is also showing bullish divergence, indicating potential for further gains.
Analysis
The past 3 months show a bullish trend with significant support at 19000. The RSI indicates overbought conditions, while MACD supports upward momentum. Volume spikes on recent up days suggest strong buying interest.
Confidence Level
Potential Risks
Market volatility and external news could impact this prediction, especially if there are sudden economic announcements.
1 Week Prediction
Target: June 6, 2025$19400
$19350
$19550
$19250
Description
The bullish trend is expected to continue, with the price likely to test resistance around 19500. The recent candlestick patterns indicate strong buying pressure, although overbought conditions may lead to a pullback.
Analysis
The stock has shown resilience with a clear upward trend. Key resistance at 19500 and support at 19000 are critical. The MACD remains bullish, but the RSI suggests caution due to overbought levels.
Confidence Level
Potential Risks
Potential market corrections and geopolitical events could introduce volatility, impacting the upward trajectory.
1 Month Prediction
Target: June 30, 2025$19600
$19500
$19800
$19200
Description
Continued bullish sentiment and strong earnings reports are likely to push prices higher. However, the market may face resistance at 19800, and profit-taking could lead to short-term corrections.
Analysis
The stock has maintained a bullish trend with significant support at 19000. The MACD and RSI indicate strong momentum, but caution is warranted as the market approaches resistance levels.
Confidence Level
Potential Risks
Economic data releases and potential interest rate changes could create volatility, affecting the stock's performance.
3 Months Prediction
Target: August 30, 2025$20000
$19800
$20500
$19500
Description
If the current bullish trend persists, the stock could reach 20000, driven by strong market fundamentals. However, external economic factors may introduce volatility.
Analysis
The stock has shown a strong upward trajectory, but potential resistance at 20000 could lead to profit-taking. The overall market sentiment remains bullish, but external factors could introduce risks.
Confidence Level
Potential Risks
Unforeseen economic downturns or changes in market sentiment could lead to significant corrections, impacting the forecast.