NSDQ Trading Predictions
1 Day Prediction
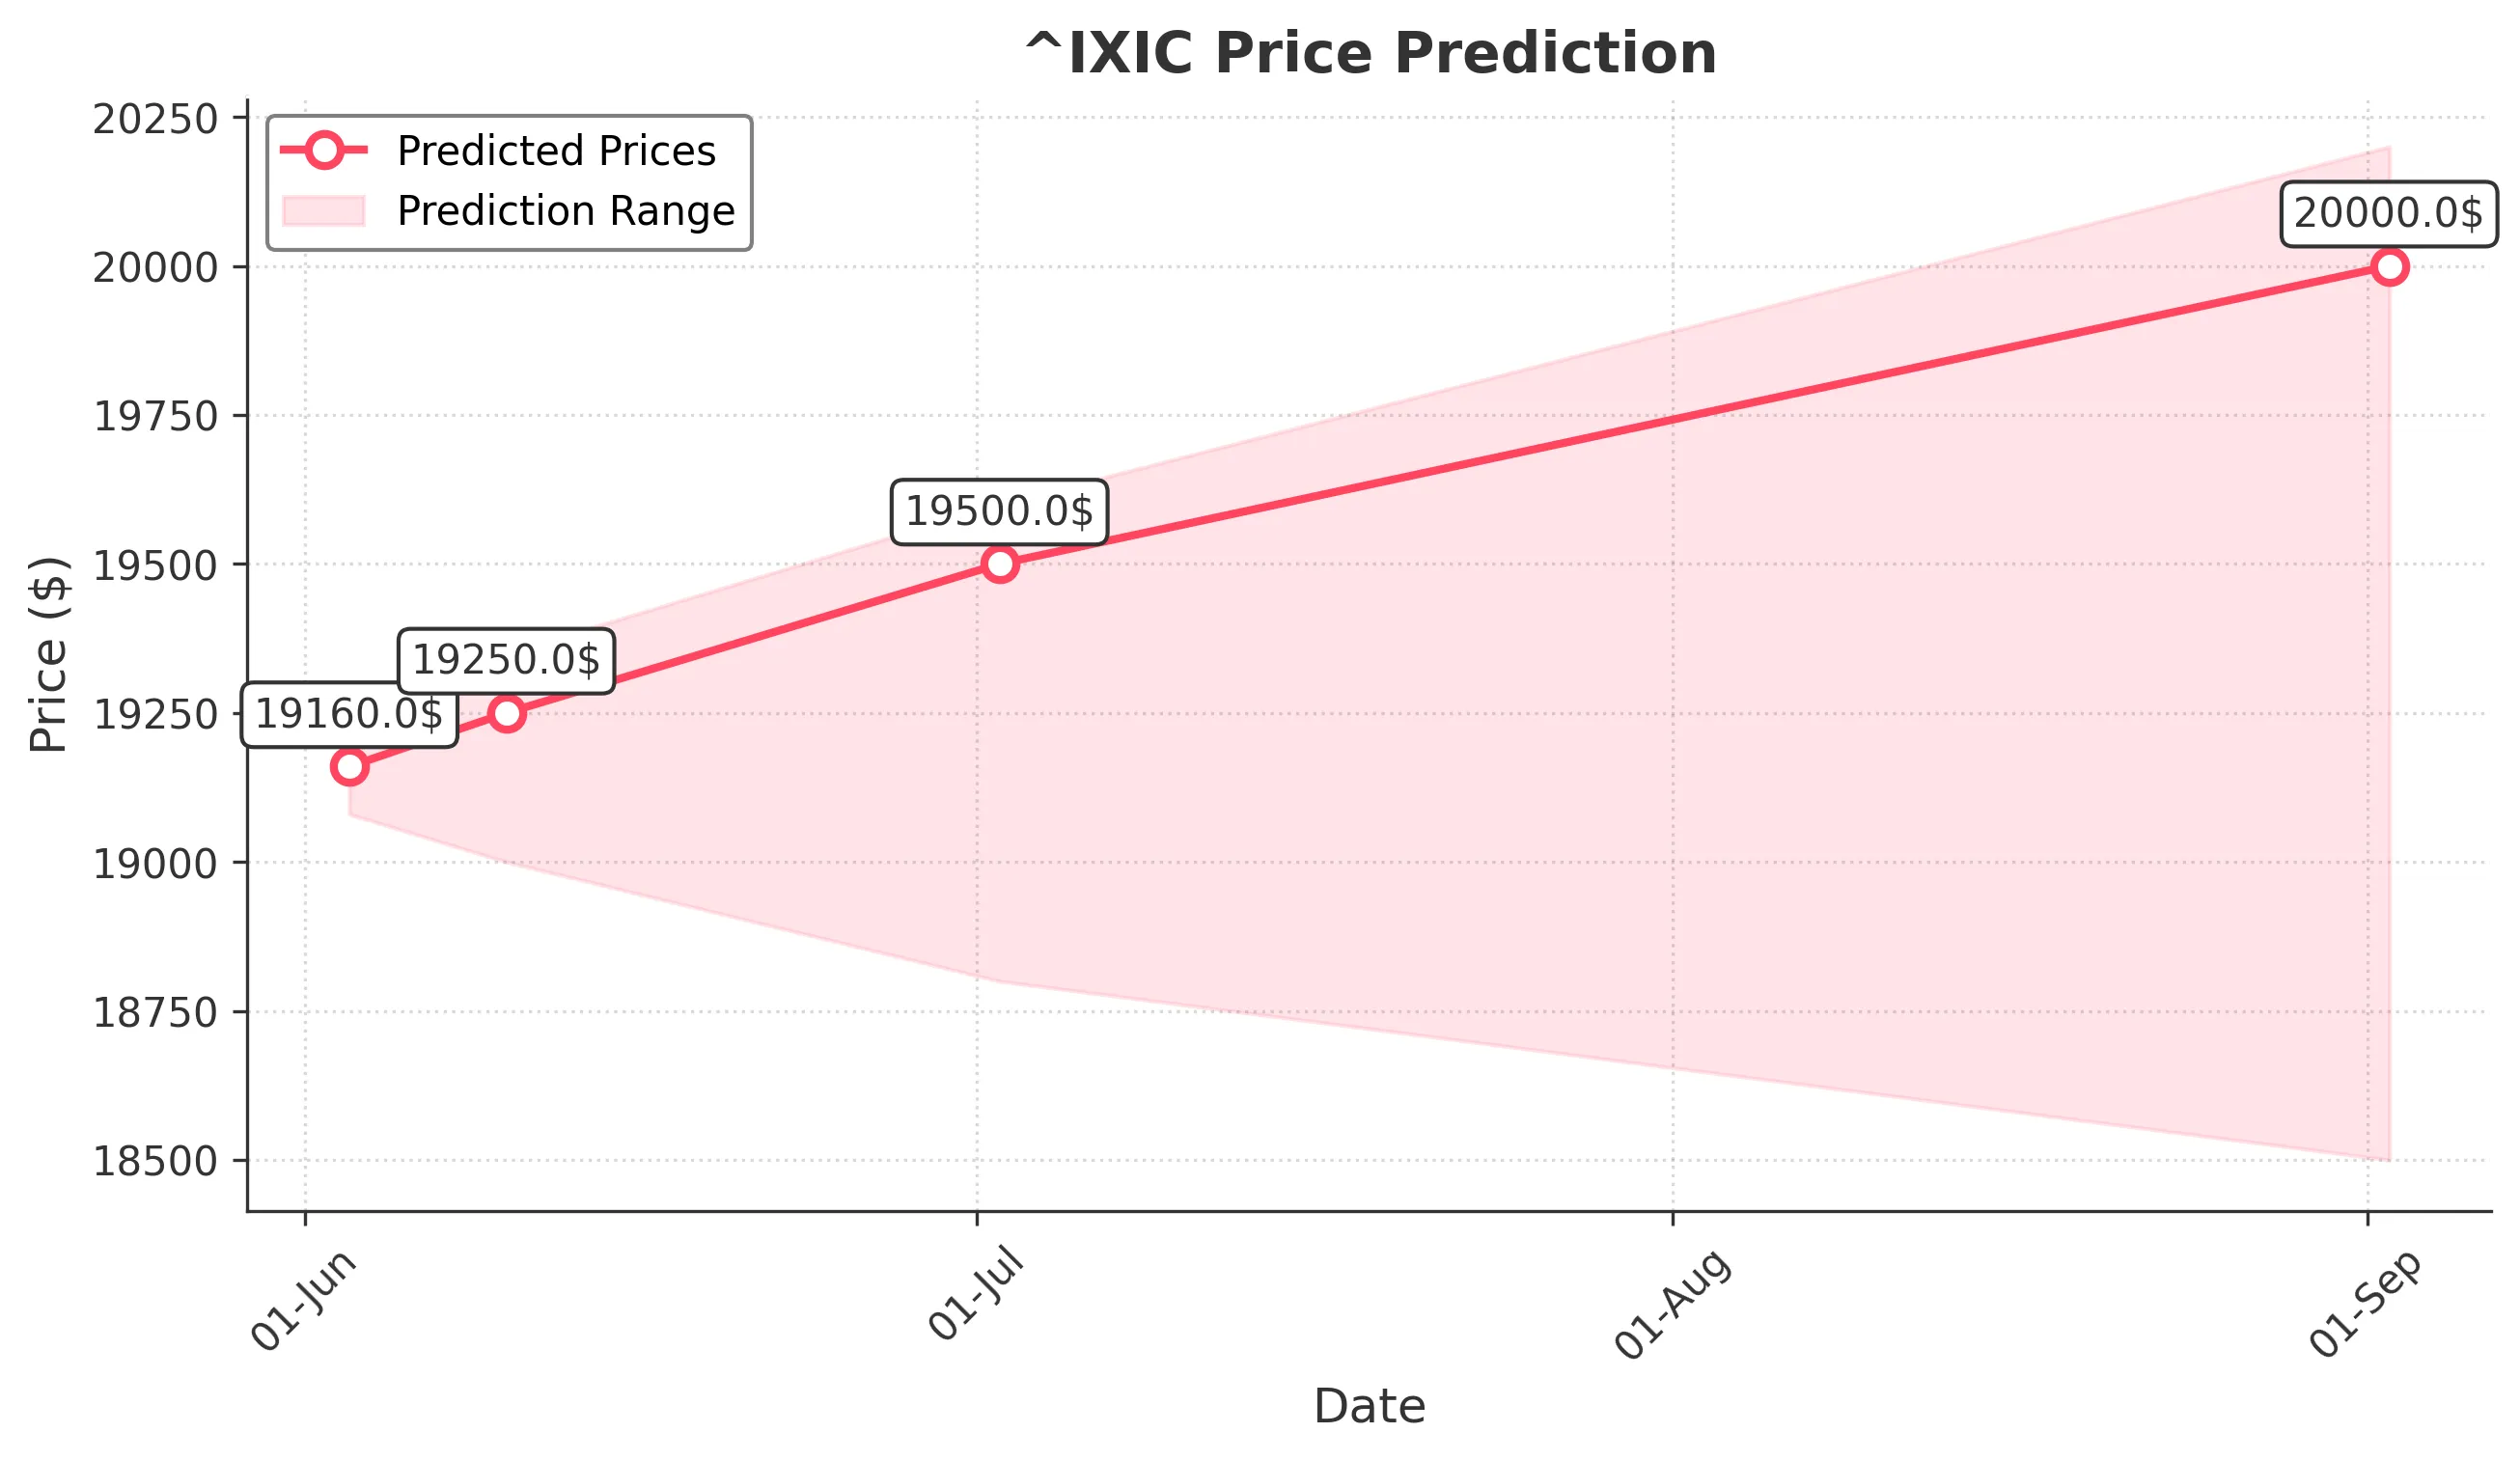
Target: June 3, 2025$19160
$19150
$19200
$19080
Description
The market shows bullish momentum with a recent upward trend. The RSI is approaching overbought levels, indicating potential for a pullback. However, strong buying volume suggests continued upward pressure. Watch for potential resistance at 19200.
Analysis
The past 3 months show a bullish trend with significant support at 19000. The MACD indicates upward momentum, while Bollinger Bands suggest volatility. Volume spikes on up days indicate strong buying interest, but caution is warranted as the market approaches overbought conditions.
Confidence Level
Potential Risks
Potential for a pullback if RSI exceeds overbought levels. Market sentiment could shift due to external news.
1 Week Prediction
Target: June 10, 2025$19250
$19180
$19350
$19000
Description
The bullish trend is expected to continue, supported by strong volume and positive market sentiment. However, the RSI indicates potential overbought conditions, which could lead to a correction. Resistance at 19350 may limit upside.
Analysis
The stock has shown consistent upward movement, with key support at 19000. The MACD remains positive, and volume patterns indicate strong buying. However, the market is nearing overbought territory, which could lead to a pullback.
Confidence Level
Potential Risks
Market volatility and external economic factors could impact the prediction. A correction could occur if the RSI remains high.
1 Month Prediction
Target: July 2, 2025$19500
$19200
$19600
$18800
Description
The bullish trend is expected to persist, with strong support at 19000. The market sentiment remains positive, but caution is advised as the RSI approaches overbought levels. Resistance at 19600 could pose challenges.
Analysis
The stock has been on a bullish trajectory, with significant support at 19000. The MACD and moving averages indicate upward momentum, but the RSI suggests caution. Volume patterns show strong buying interest, but the market's overbought status could lead to volatility.
Confidence Level
Potential Risks
Potential for market corrections due to overbought conditions. External economic events could also influence market direction.
3 Months Prediction
Target: September 2, 2025$20000
$19500
$20200
$18500
Description
Long-term bullish outlook supported by strong fundamentals and market sentiment. However, potential corrections may occur as the market approaches key resistance levels. Watch for external economic influences.
Analysis
The stock has shown a strong bullish trend over the past three months, with key support at 19000. The MACD and moving averages indicate continued upward momentum, but the market is susceptible to corrections. Volume patterns suggest strong buying interest, but external factors could impact future performance.
Confidence Level
Potential Risks
Market volatility and economic uncertainties could lead to unexpected corrections. The potential for a bearish reversal exists if key support levels are breached.