NSDQ Trading Predictions
1 Day Prediction
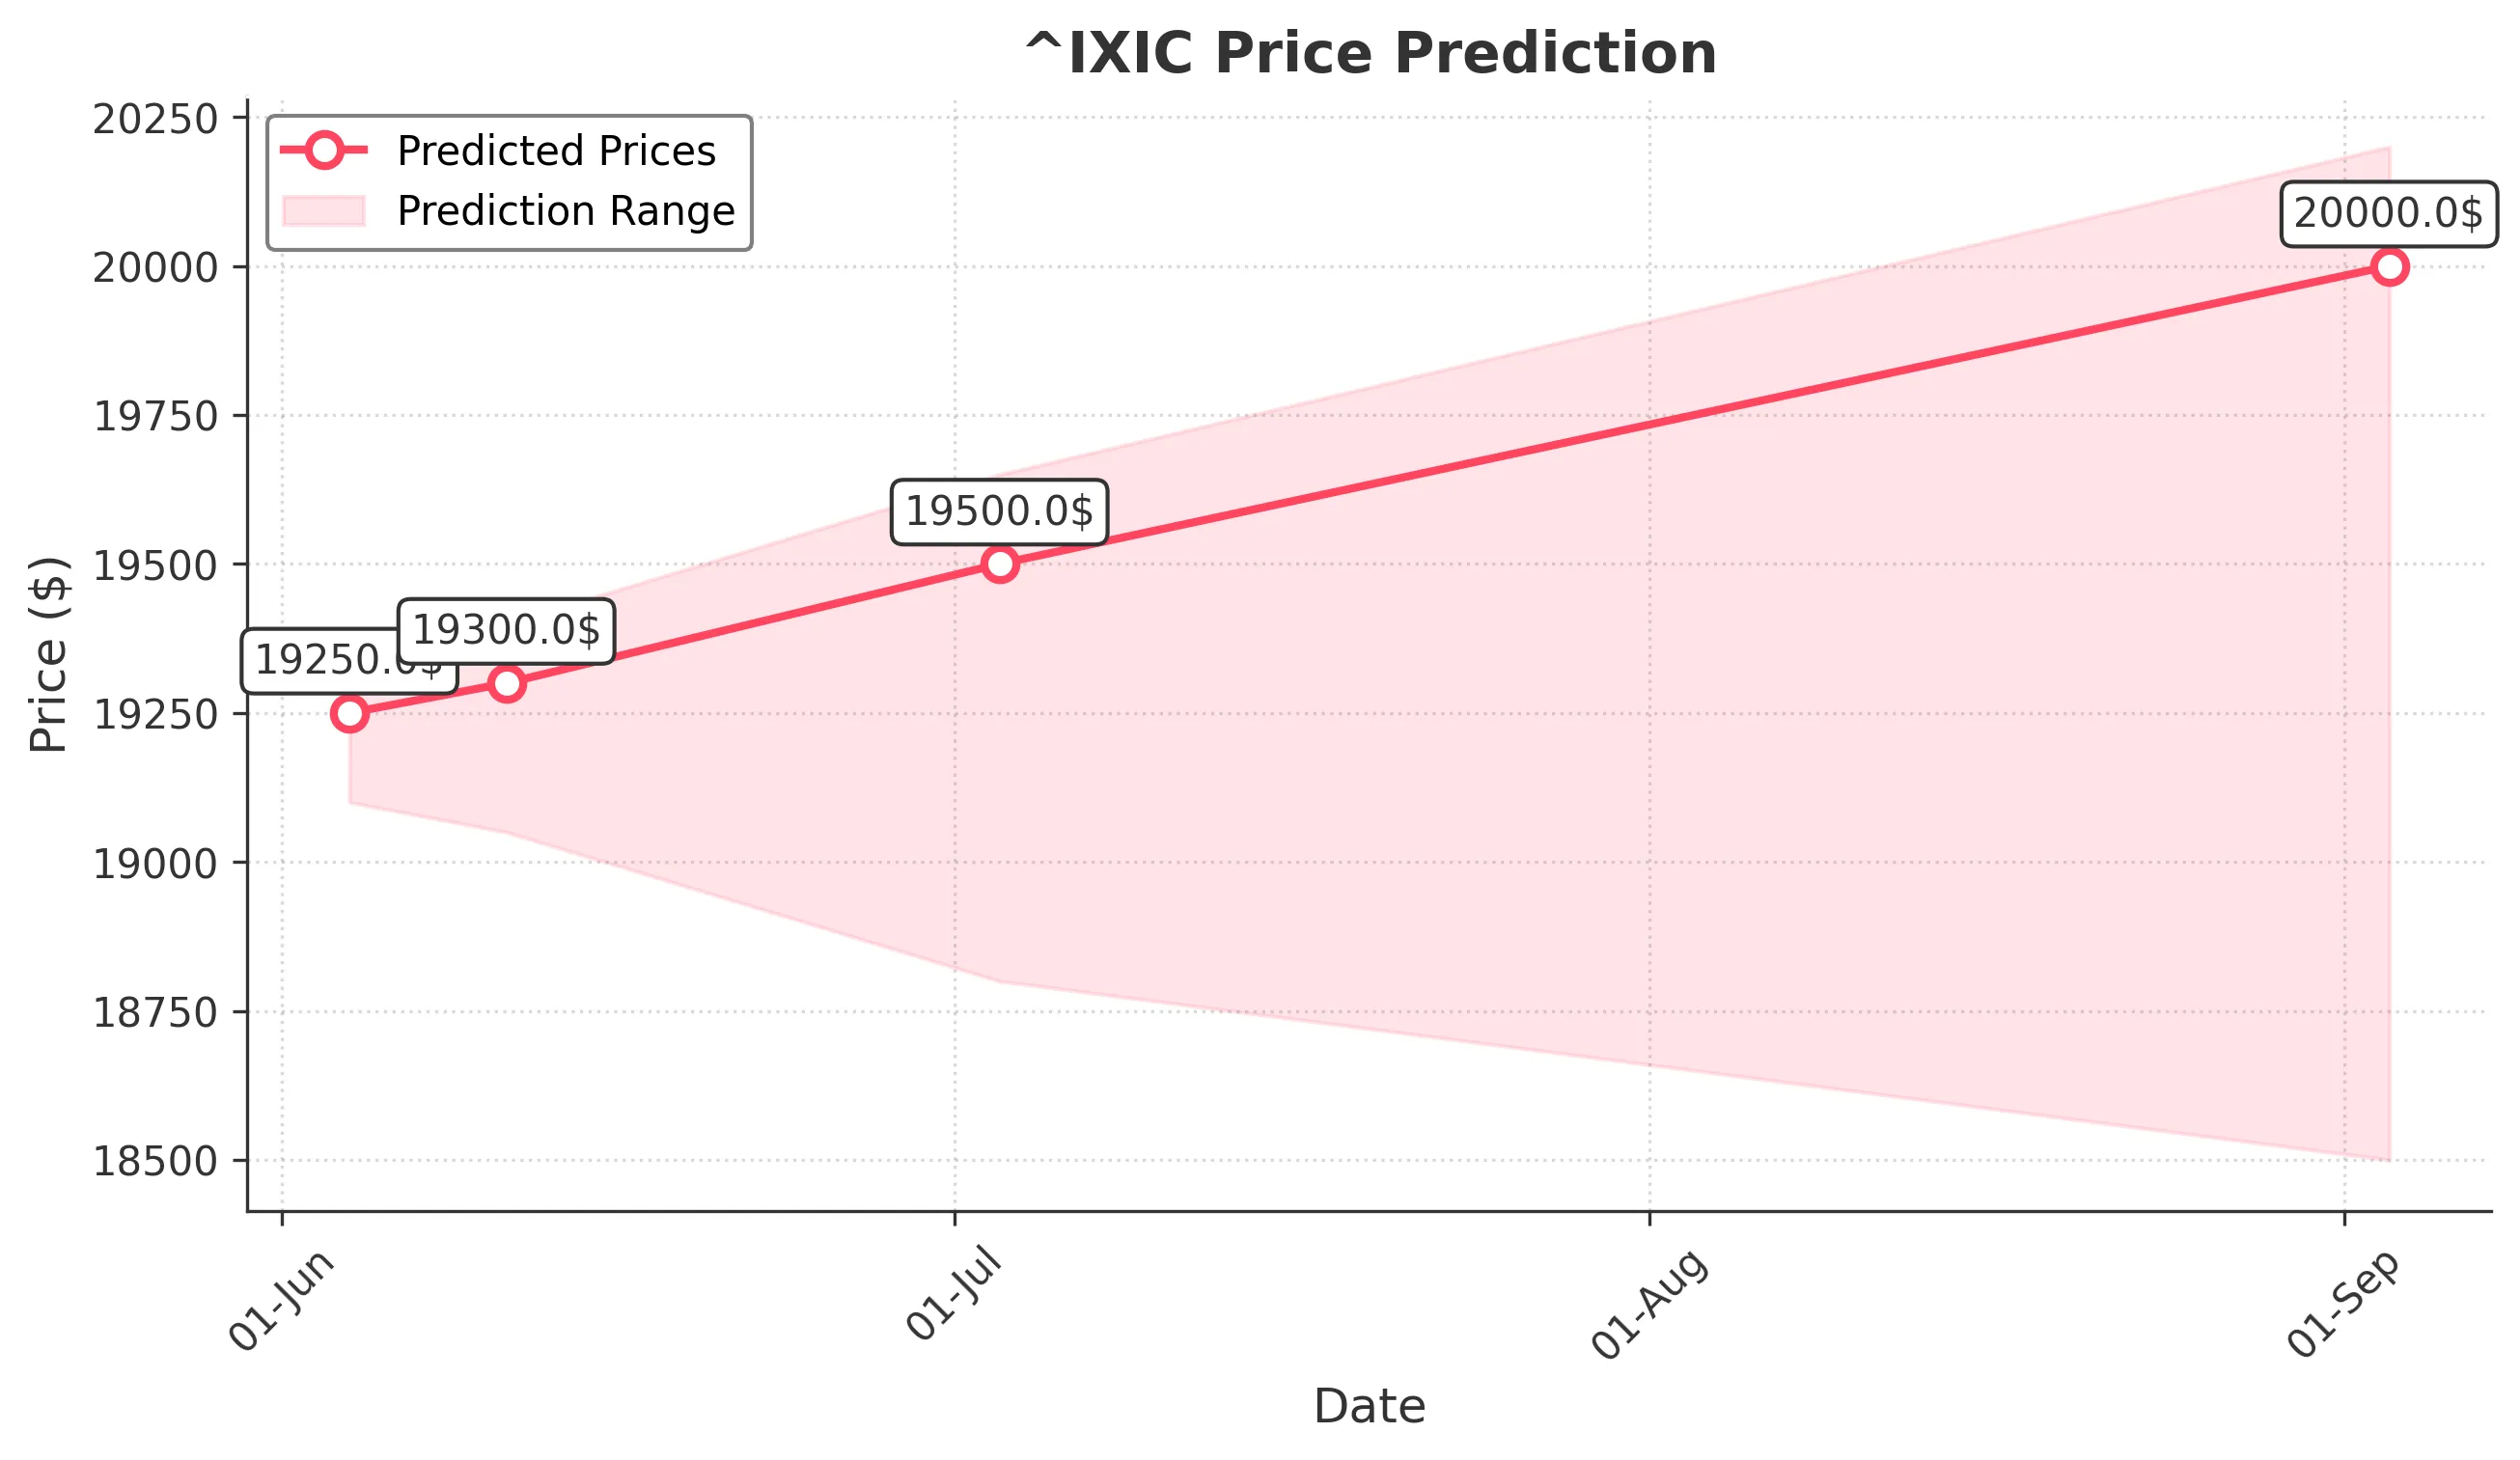
Target: June 4, 2025$19250
$19240
$19300
$19100
Description
The recent bullish momentum, supported by a strong MACD crossover and RSI nearing overbought levels, suggests a continuation of upward movement. However, caution is advised as the market may face resistance at 19300.
Analysis
The past three months show a bullish trend with significant support at 19000 and resistance around 19300. The MACD indicates upward momentum, while the RSI suggests overbought conditions. Volume has been robust, indicating strong interest.
Confidence Level
Potential Risks
Potential profit-taking could lead to volatility, and external market factors may influence sentiment.
1 Week Prediction
Target: June 11, 2025$19300
$19250
$19400
$19050
Description
The bullish trend is expected to persist, with the price likely testing the 19400 resistance level. The recent candlestick patterns indicate strong buying pressure, but a pullback could occur if the RSI remains overbought.
Analysis
The stock has shown a strong upward trajectory, with key support at 19000. The MACD remains bullish, and volume spikes indicate strong buying interest. However, the RSI suggests caution as it approaches overbought territory.
Confidence Level
Potential Risks
Market corrections are possible, especially if external economic news impacts investor sentiment.
1 Month Prediction
Target: July 3, 2025$19500
$19300
$19650
$18800
Description
Continued bullish sentiment is expected, with potential for the price to reach 19500. The Fibonacci retracement levels support this upward movement, but caution is warranted as the market may face resistance at 19650.
Analysis
The stock has maintained a bullish trend, with significant support at 19000. The MACD and RSI indicate strong momentum, but the market's reaction to macroeconomic events could lead to fluctuations.
Confidence Level
Potential Risks
Economic indicators and geopolitical events could introduce volatility, impacting the bullish trend.
3 Months Prediction
Target: September 3, 2025$20000
$19500
$20200
$18500
Description
If the current bullish trend continues, the price could reach 20000. However, market volatility and potential corrections may lead to fluctuations. The overall sentiment remains positive, but caution is advised.
Analysis
The stock has shown a strong upward trend, with key support at 19000 and resistance at 20000. The MACD indicates bullish momentum, but the RSI suggests potential overbought conditions. External factors could introduce volatility.
Confidence Level
Potential Risks
Unforeseen economic events or market corrections could significantly impact the price trajectory.