NSDQ Trading Predictions
1 Day Prediction
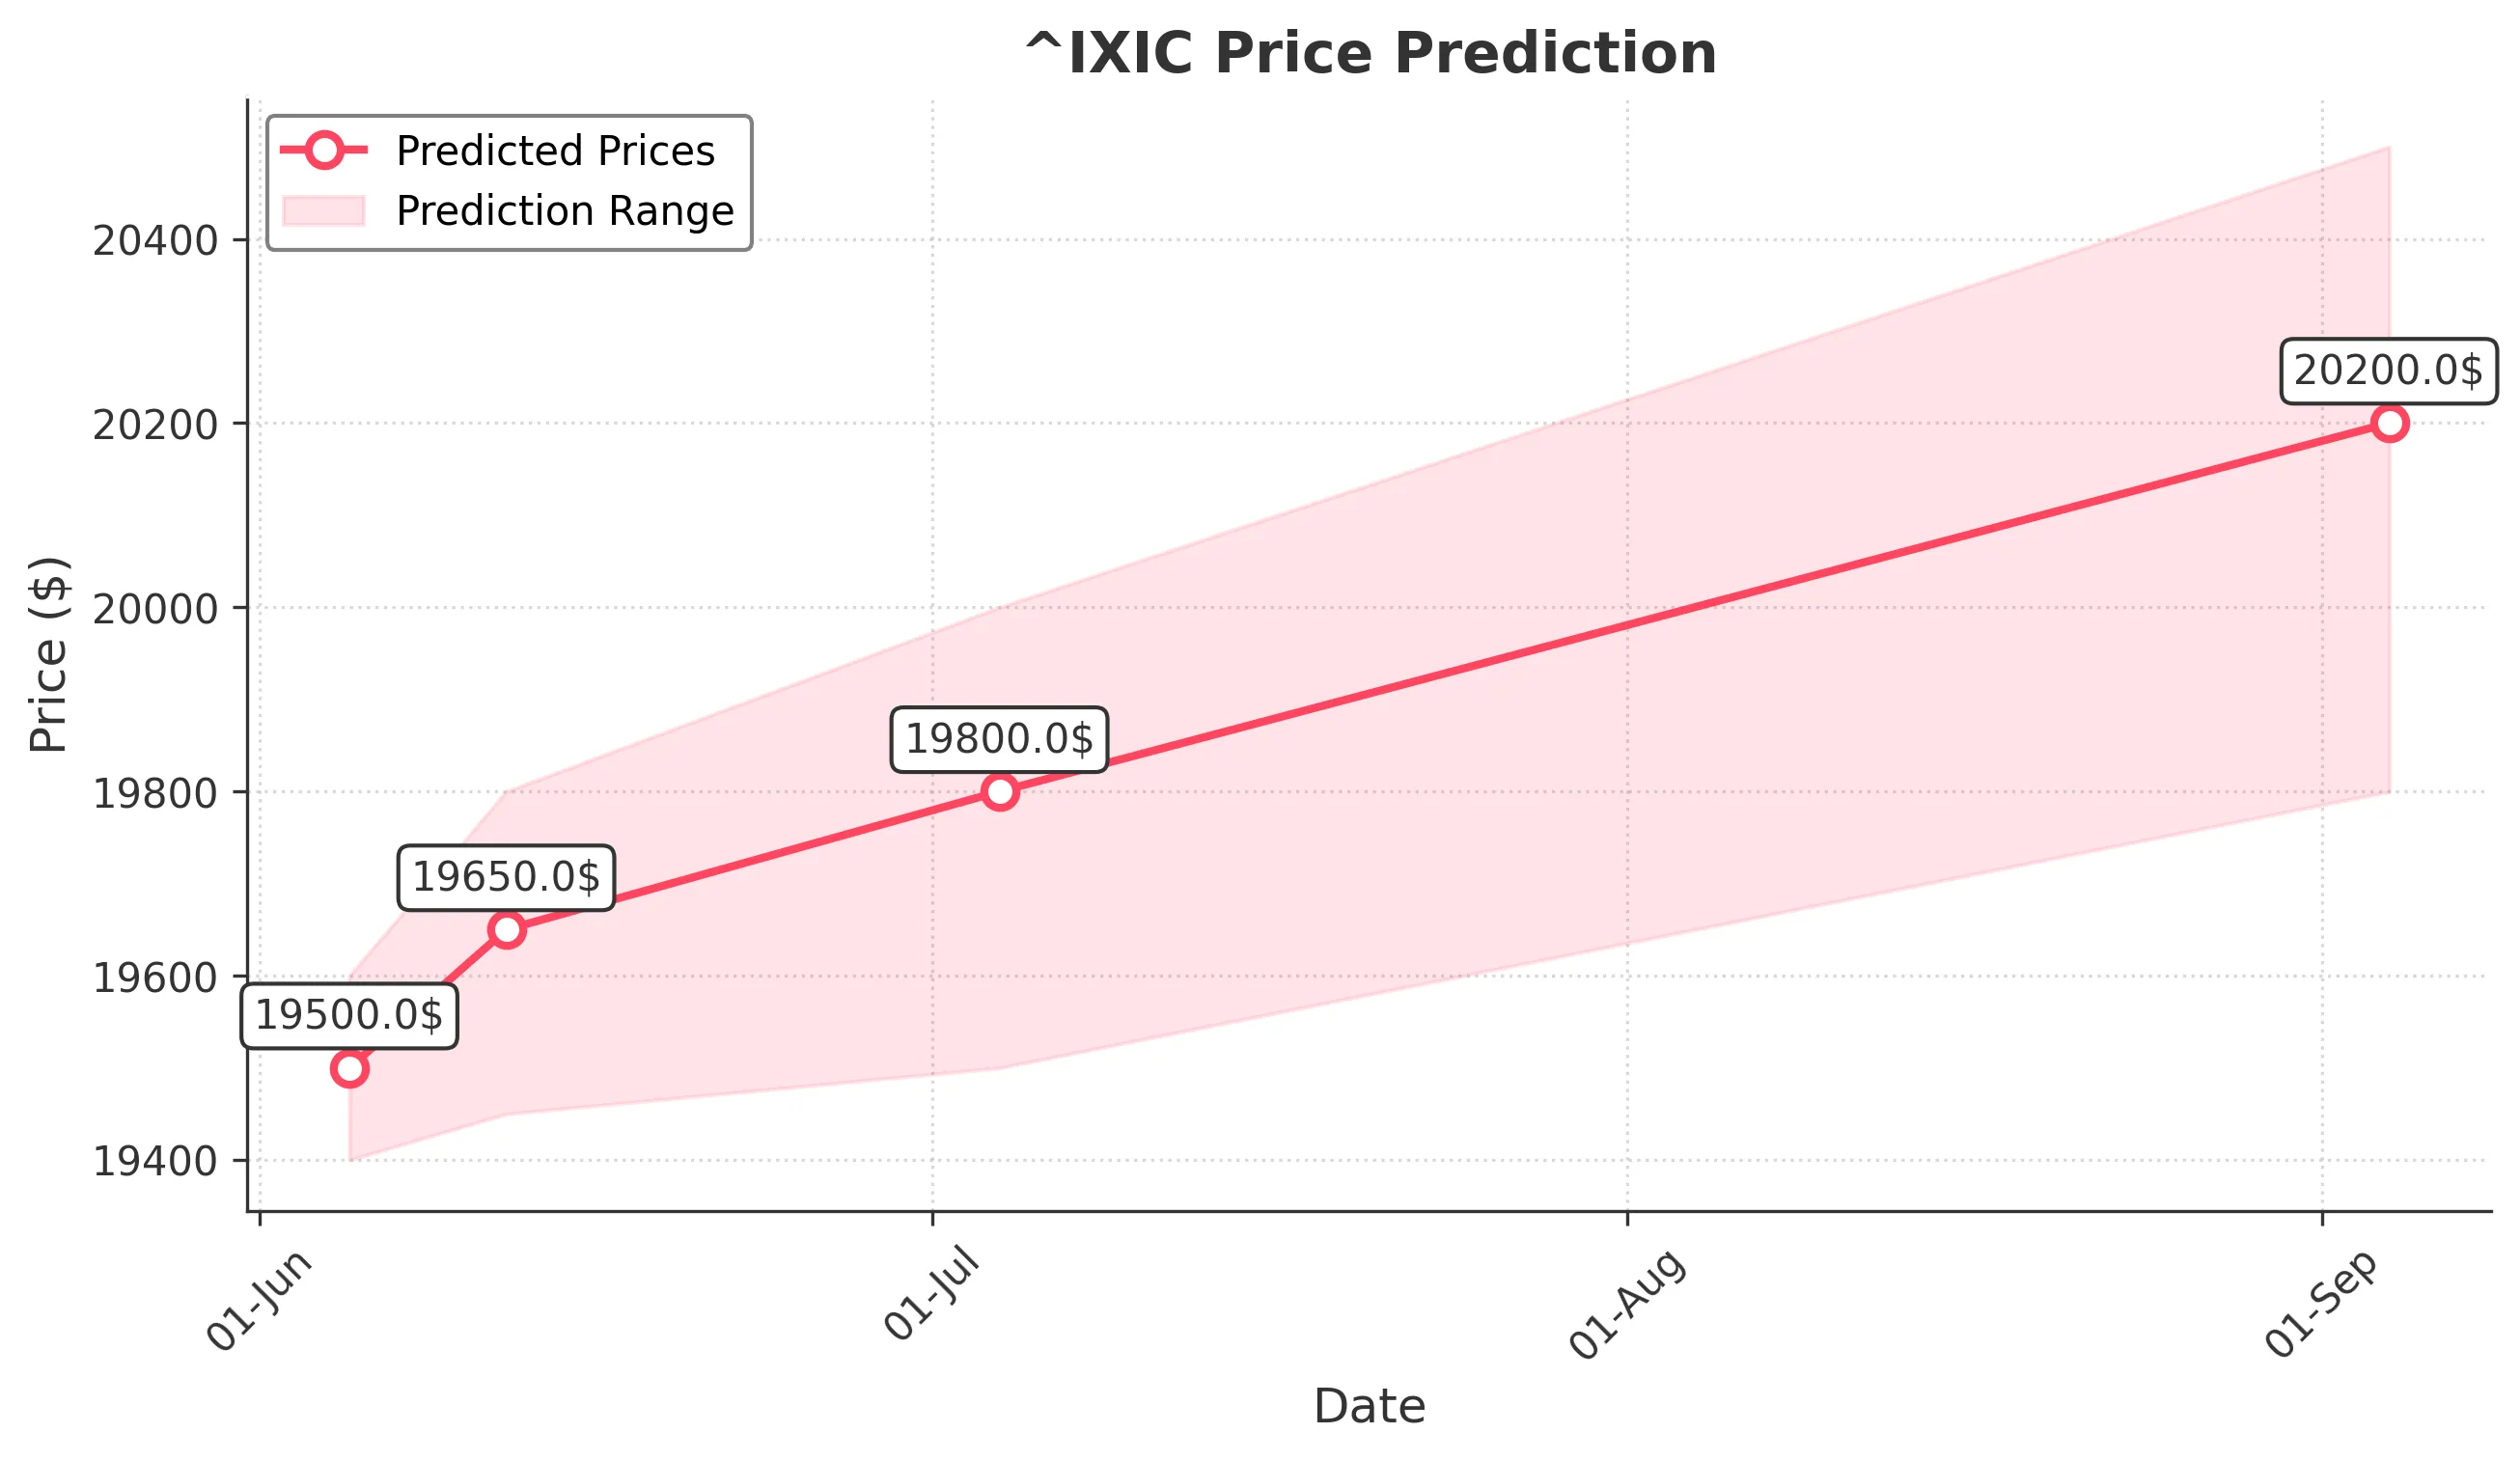
Target: June 5, 2025$19500
$19480
$19600
$19400
Description
The recent bullish momentum, supported by a strong MACD crossover and RSI nearing overbought levels, suggests a continuation of upward movement. The price is expected to test resistance around 19600.
Analysis
The past 3 months show a bullish trend with significant support at 19000 and resistance at 19600. Volume has increased during upward moves, indicating strong buying interest. The MACD and RSI suggest further upward potential, but caution is warranted.
Confidence Level
Potential Risks
Potential profit-taking could lead to volatility, and external market factors may impact sentiment.
1 Week Prediction
Target: June 12, 2025$19650
$19500
$19800
$19450
Description
With the bullish trend continuing, the price is likely to reach new highs. The Bollinger Bands indicate potential for upward movement, but the RSI suggests caution as it approaches overbought territory.
Analysis
The stock has shown strong upward momentum, with key support at 19000. The MACD remains bullish, and volume patterns indicate strong buying. However, the RSI nearing overbought levels suggests a potential pullback.
Confidence Level
Potential Risks
Market corrections or negative news could reverse the trend, impacting the forecast.
1 Month Prediction
Target: July 4, 2025$19800
$19650
$20000
$19500
Description
The upward trend is expected to continue, with the price testing the psychological level of 20000. The Fibonacci retracement levels support this bullish outlook, but caution is advised as the market may face resistance.
Analysis
The stock has been in a strong bullish phase, with significant support at 19500. The MACD and RSI indicate continued upward momentum, but potential resistance at 20000 could lead to a pullback.
Confidence Level
Potential Risks
Economic data releases or geopolitical events could introduce volatility and affect the price trajectory.
3 Months Prediction
Target: September 4, 2025$20200
$20000
$20500
$19800
Description
The bullish trend is expected to persist, with the price potentially reaching 20500. However, market corrections and external factors could introduce volatility, necessitating caution.
Analysis
The stock has shown resilience with a bullish trend, but potential resistance at 20500 may lead to corrections. The MACD remains positive, but the RSI indicates overbought conditions, suggesting a need for caution.
Confidence Level
Potential Risks
Unforeseen economic events or shifts in market sentiment could lead to significant price fluctuations.