NSDQ Trading Predictions
1 Day Prediction
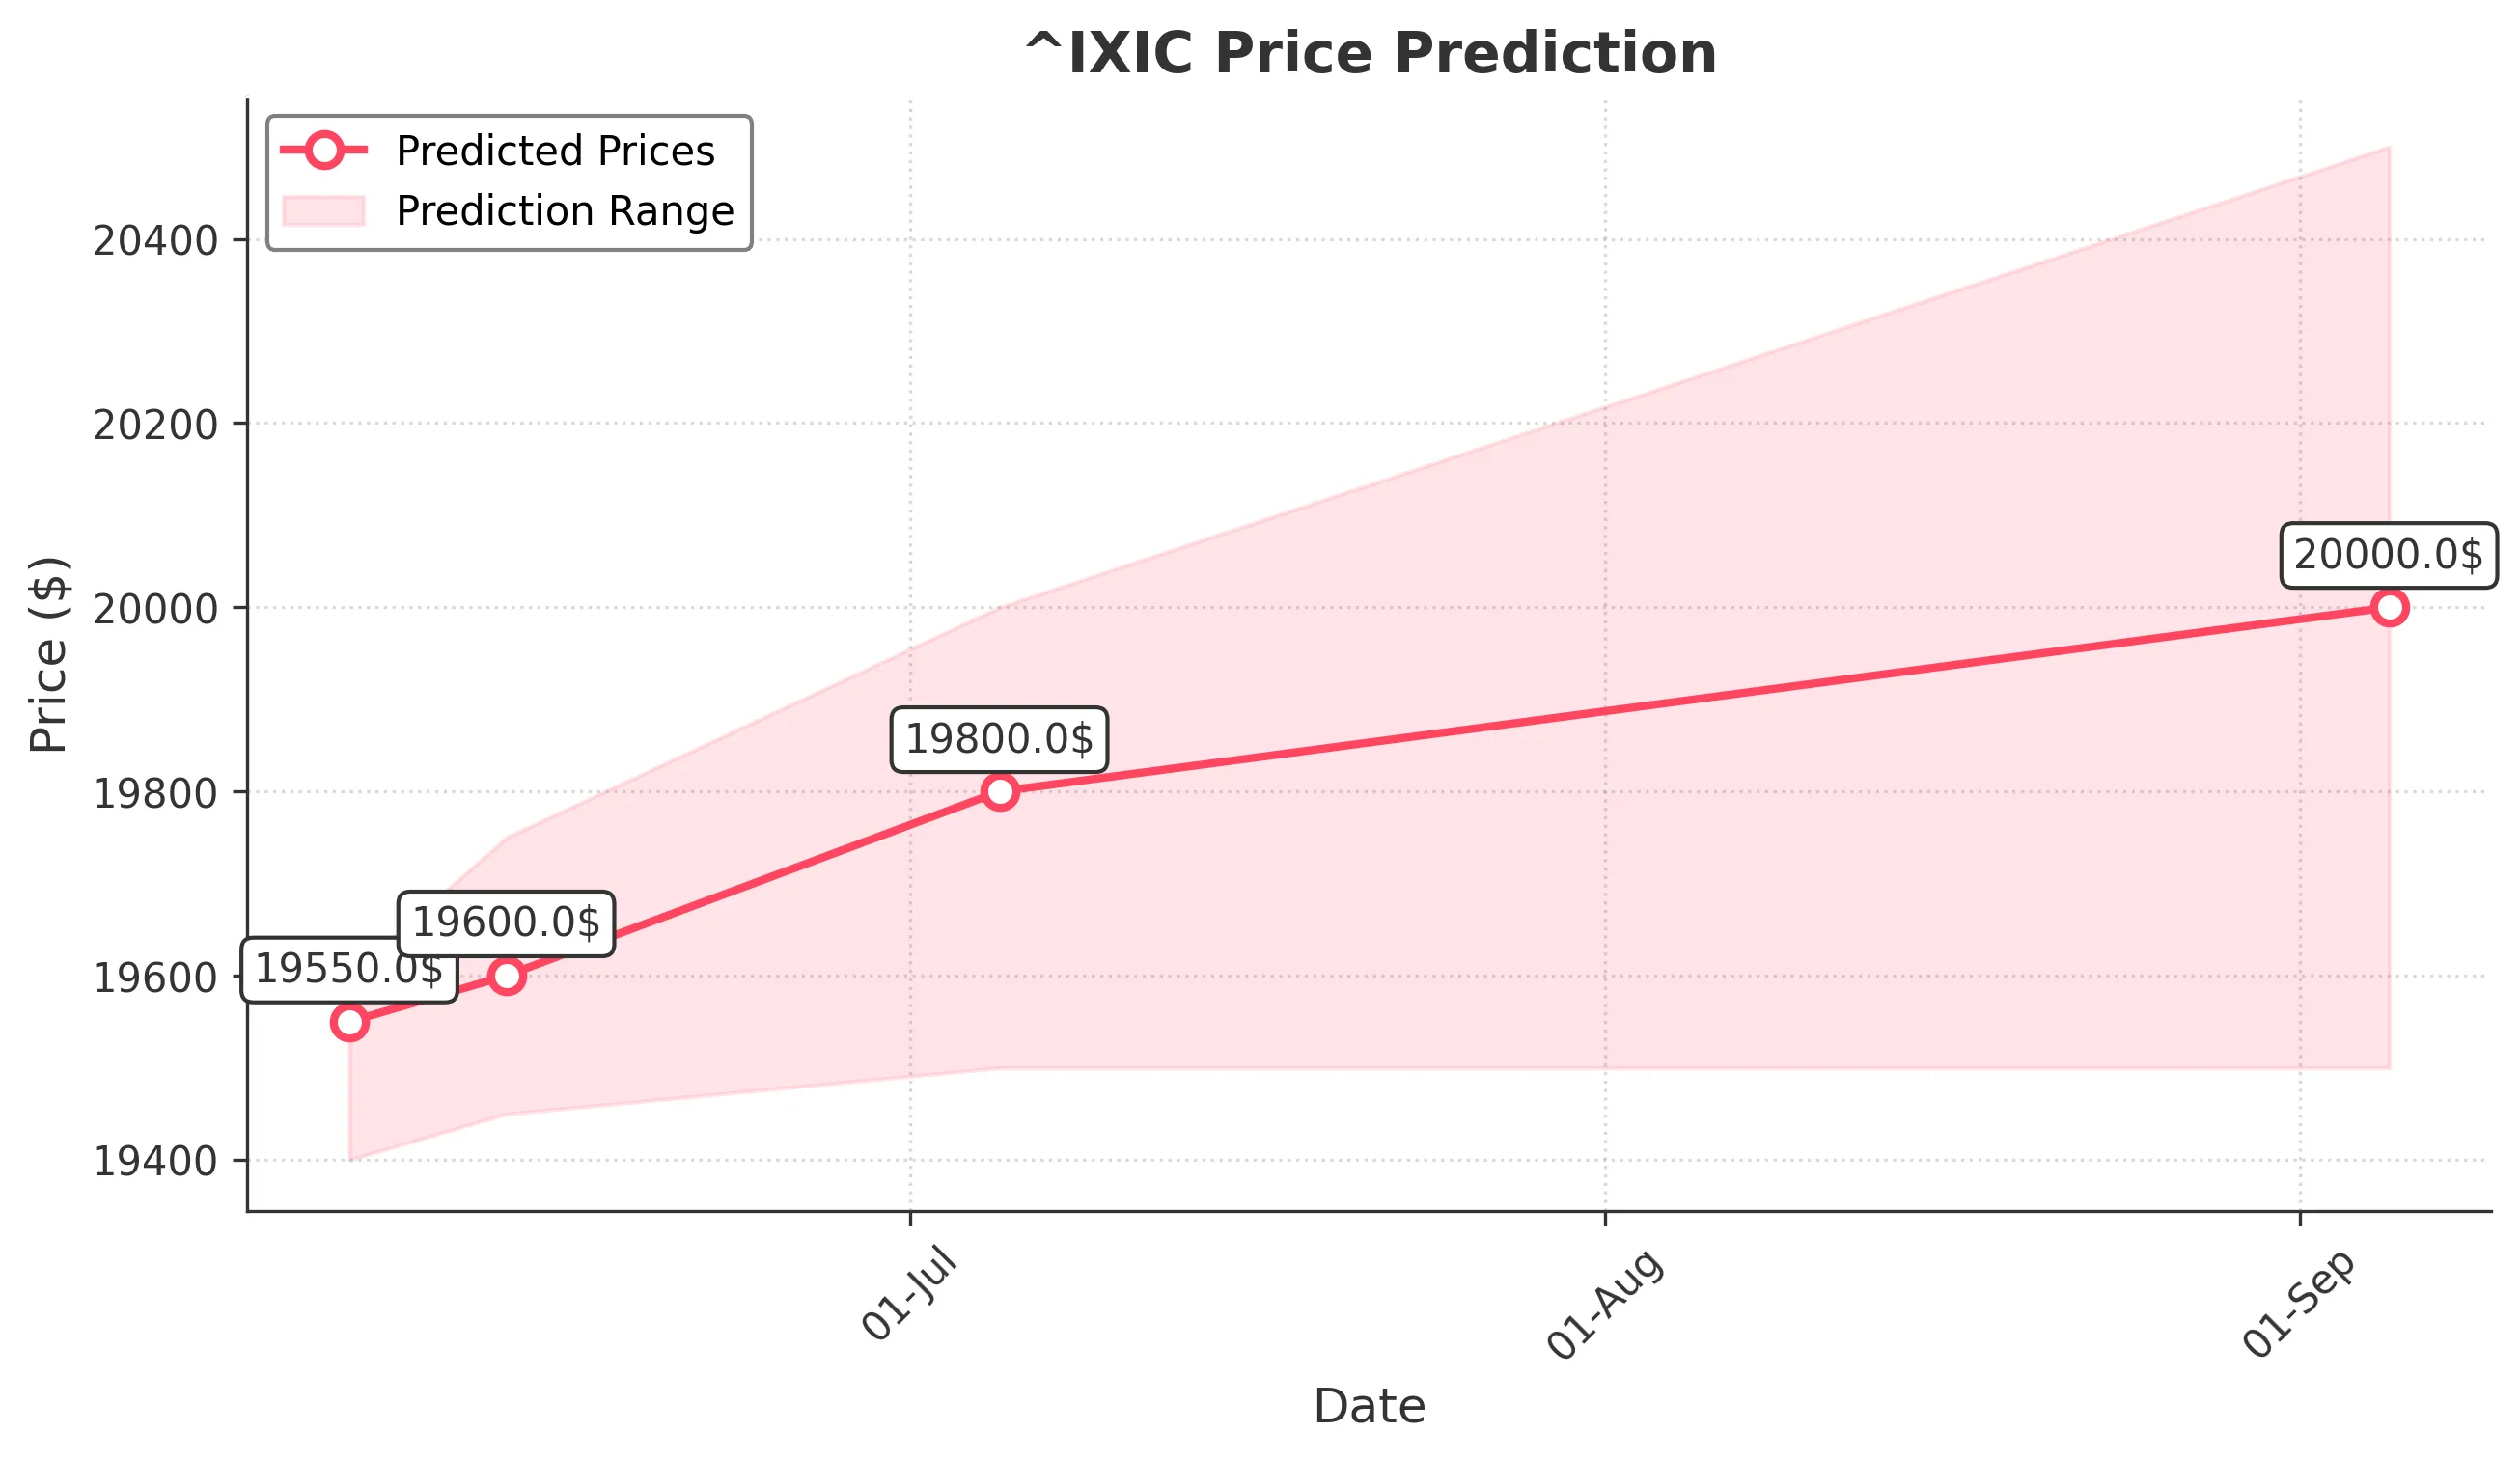
Target: June 6, 2025$19550
$19500
$19600
$19400
Description
The stock shows bullish momentum with a recent close above the 20-day moving average. RSI indicates overbought conditions, suggesting a potential pullback. However, MACD remains positive, supporting further gains. Expect slight volatility.
Analysis
The past 3 months show a bullish trend with significant support at 19000. Recent volume spikes indicate strong buying interest. Technical indicators like MACD and moving averages support upward momentum, but RSI suggests caution due to overbought conditions.
Confidence Level
Potential Risks
Potential market corrections or external news could impact the price.
1 Week Prediction
Target: June 13, 2025$19600
$19550
$19750
$19450
Description
The bullish trend is expected to continue, supported by strong market sentiment and positive technical indicators. However, the RSI indicates potential overbought conditions, which may lead to short-term corrections.
Analysis
The stock has shown a strong upward trend, with resistance at 19700. The MACD is bullish, and the average volume suggests sustained interest. However, the RSI indicates overbought conditions, which could lead to corrections.
Confidence Level
Potential Risks
Market volatility and external economic factors could lead to unexpected price movements.
1 Month Prediction
Target: July 5, 2025$19800
$19650
$20000
$19500
Description
The stock is likely to maintain its upward trajectory, driven by strong fundamentals and positive market sentiment. However, the potential for profit-taking could introduce volatility.
Analysis
The overall trend remains bullish, with key support at 19500. The MACD and moving averages indicate continued upward momentum, but the RSI suggests caution. Volume patterns show strong buying interest, but external factors could introduce volatility.
Confidence Level
Potential Risks
Economic data releases and geopolitical events may impact market stability.
3 Months Prediction
Target: September 5, 2025$20000
$19800
$20500
$19500
Description
Long-term bullish sentiment is expected to prevail, supported by strong economic indicators. However, potential market corrections and external shocks could lead to fluctuations.
Analysis
The stock has shown resilience with a bullish trend, but the potential for corrections exists. Key resistance levels are at 20500, while support remains at 19500. Technical indicators suggest a strong upward trend, but external factors could introduce volatility.
Confidence Level
Potential Risks
Unforeseen economic events or changes in market sentiment could lead to significant price adjustments.