NSDQ Trading Predictions
1 Day Prediction
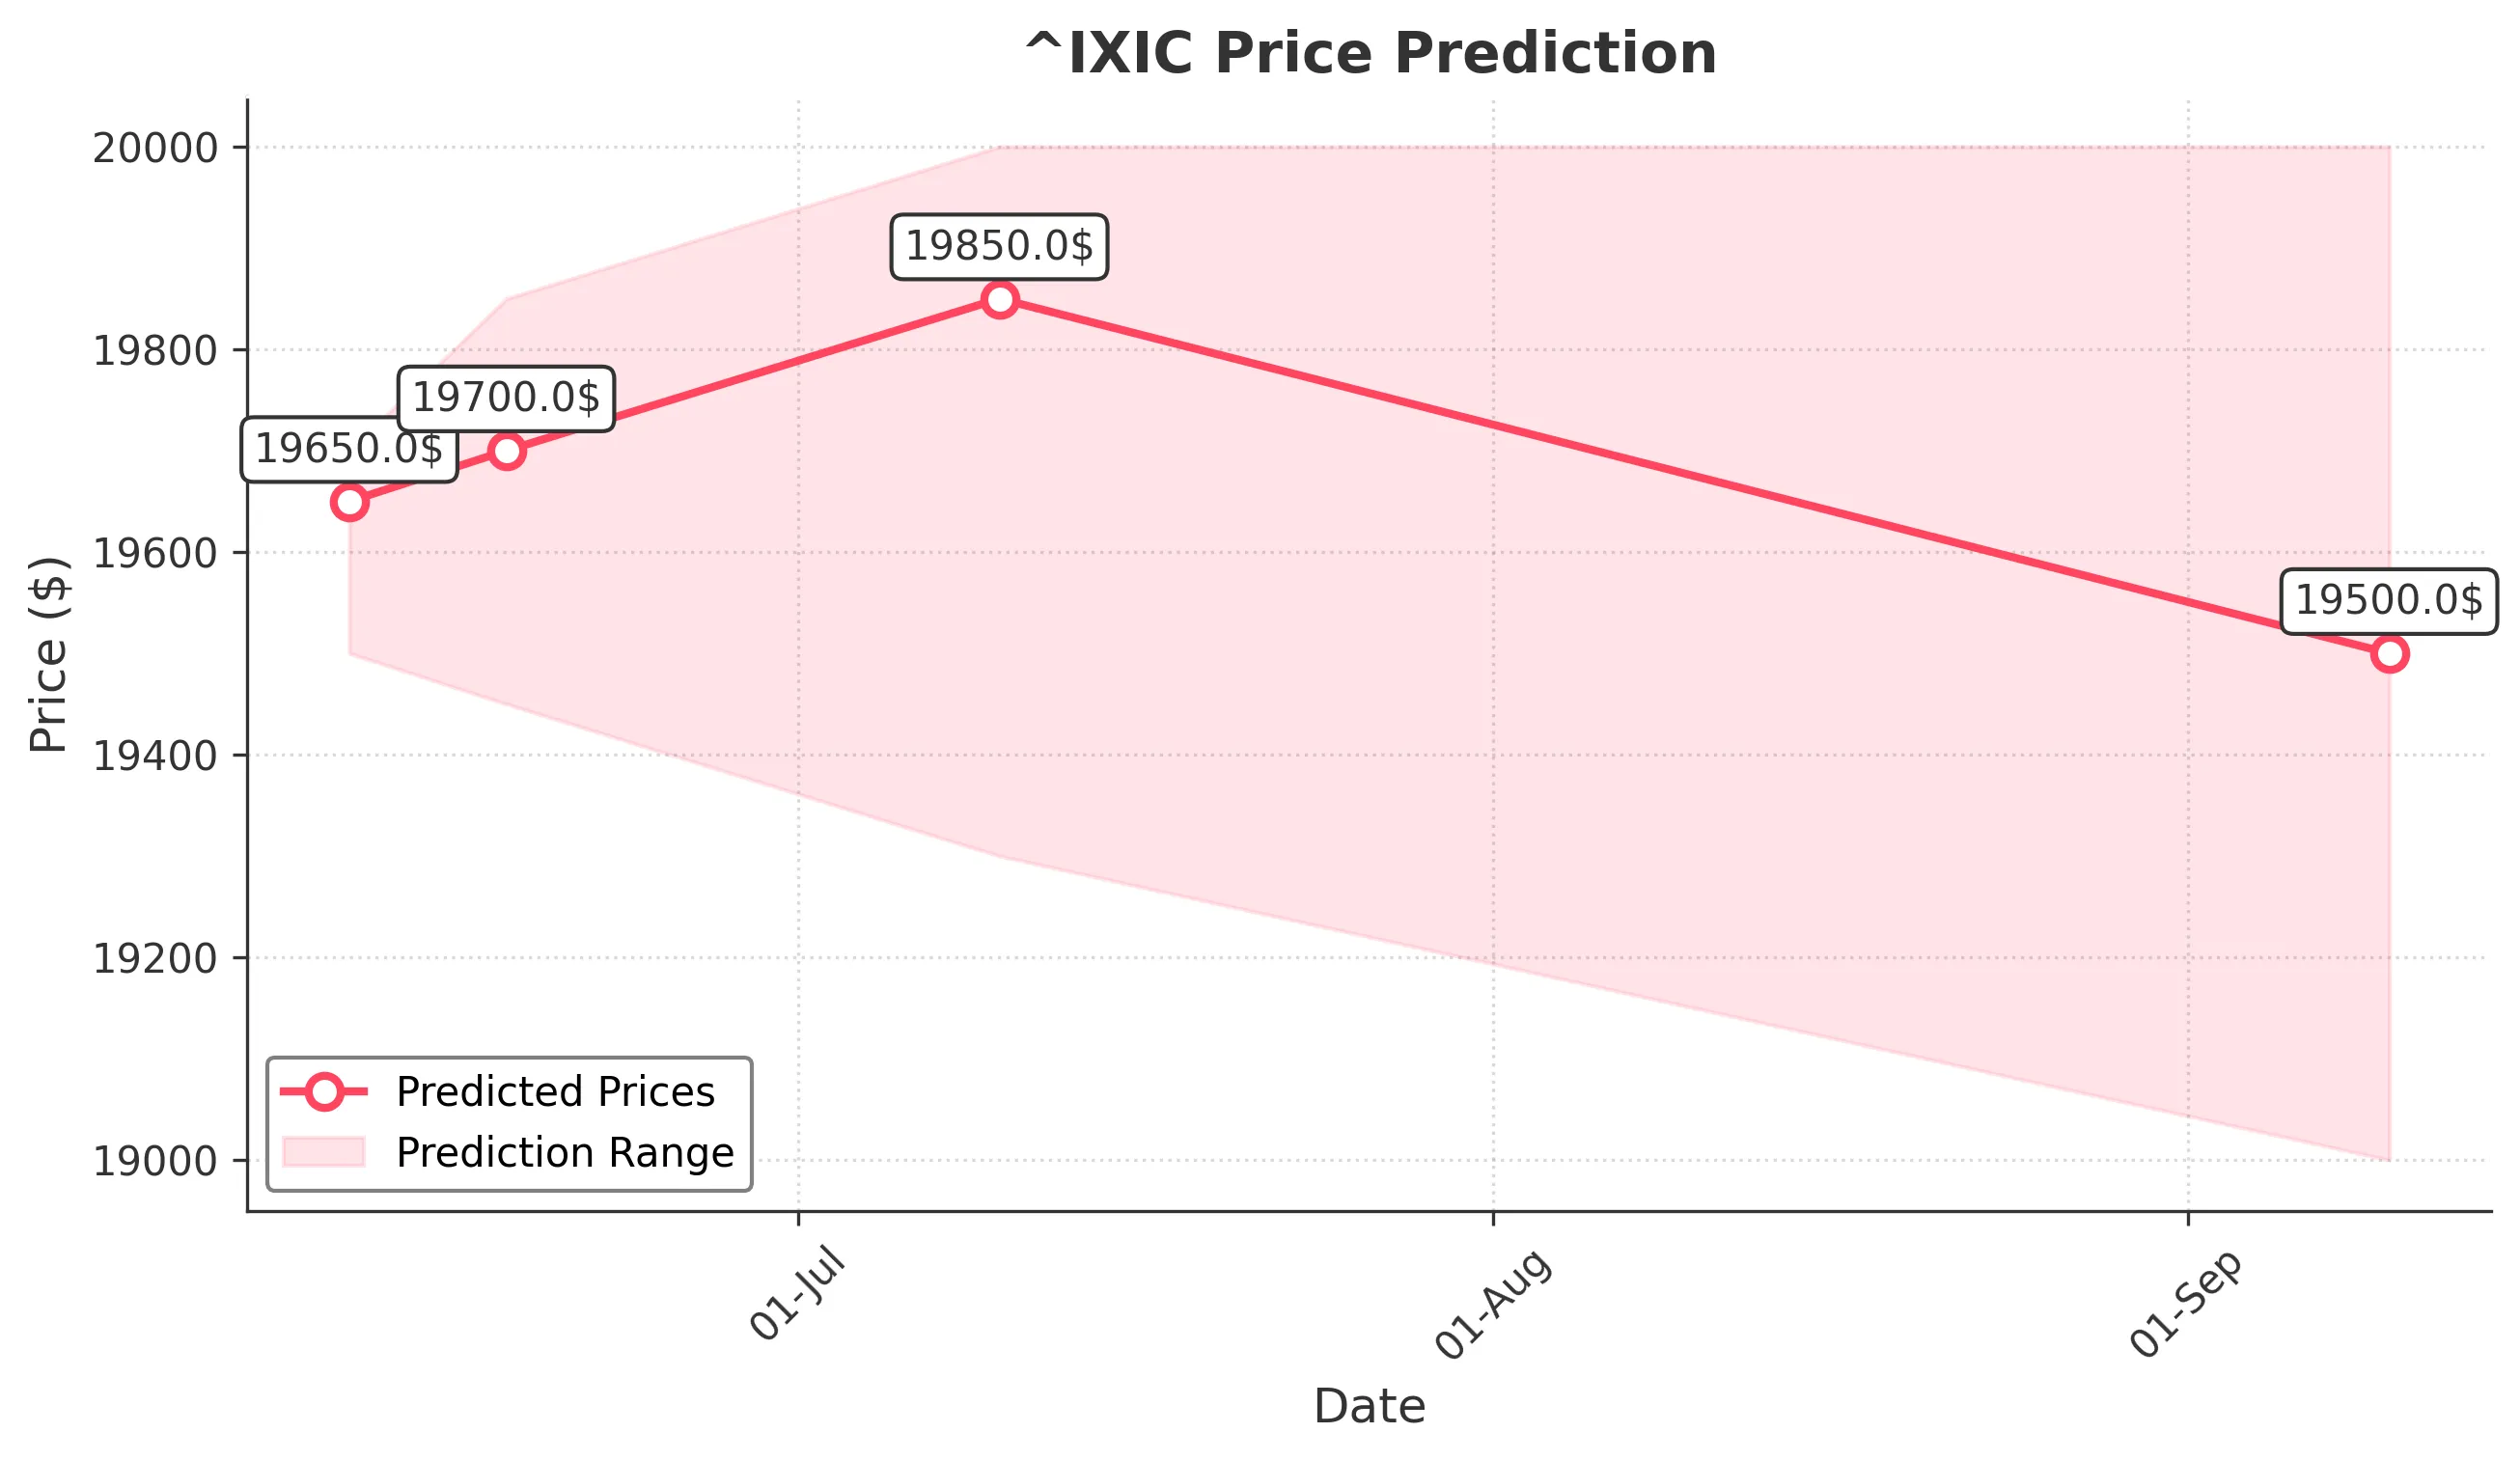
Target: June 11, 2025$19650
$19630
$19700
$19500
Description
The market shows bullish momentum with a recent upward trend. The RSI is approaching overbought levels, indicating potential for a pullback. However, strong support at 19500 suggests limited downside risk. Expect a slight increase in price.
Analysis
The past 3 months show a bullish trend with significant upward movement. Key support at 19500 and resistance at 19700. The MACD indicates bullish momentum, while volume spikes suggest strong buying interest. However, RSI nearing overbought levels raises caution.
Confidence Level
Potential Risks
Potential volatility due to macroeconomic news could impact the prediction.
1 Week Prediction
Target: June 18, 2025$19700
$19680
$19850
$19450
Description
The bullish trend is expected to continue, supported by strong buying volume. However, the RSI indicates potential overbought conditions, which may lead to a correction. Watch for resistance at 19850.
Analysis
The stock has shown consistent upward movement, with key support at 19500. The MACD remains bullish, and volume patterns indicate strong interest. However, the RSI suggests caution as it approaches overbought territory.
Confidence Level
Potential Risks
Market sentiment could shift due to external economic factors, impacting the prediction.
1 Month Prediction
Target: July 10, 2025$19850
$19700
$20000
$19300
Description
Expect continued bullish momentum, but with increased volatility. The market may test the 20000 resistance level. Watch for potential pullbacks as the RSI indicates overbought conditions.
Analysis
The stock has maintained a bullish trend, with significant support at 19500. The MACD remains positive, but the RSI indicates potential overbought conditions. Volume patterns suggest strong buying interest, but caution is warranted.
Confidence Level
Potential Risks
Economic data releases could lead to unexpected market reactions, affecting price stability.
3 Months Prediction
Target: September 10, 2025$19500
$19600
$20000
$19000
Description
Expect a potential correction as the market may face resistance at 20000. The RSI indicates overbought conditions, suggesting a pullback could occur. Watch for support at 19000.
Analysis
The stock has shown strong performance, but the potential for a correction looms as the RSI indicates overbought conditions. Key support at 19000 and resistance at 20000 will be critical in the coming months. Volume patterns suggest strong interest, but caution is advised.
Confidence Level
Potential Risks
Market volatility and economic uncertainties could lead to significant price fluctuations.