NSDQ Trading Predictions
1 Day Prediction
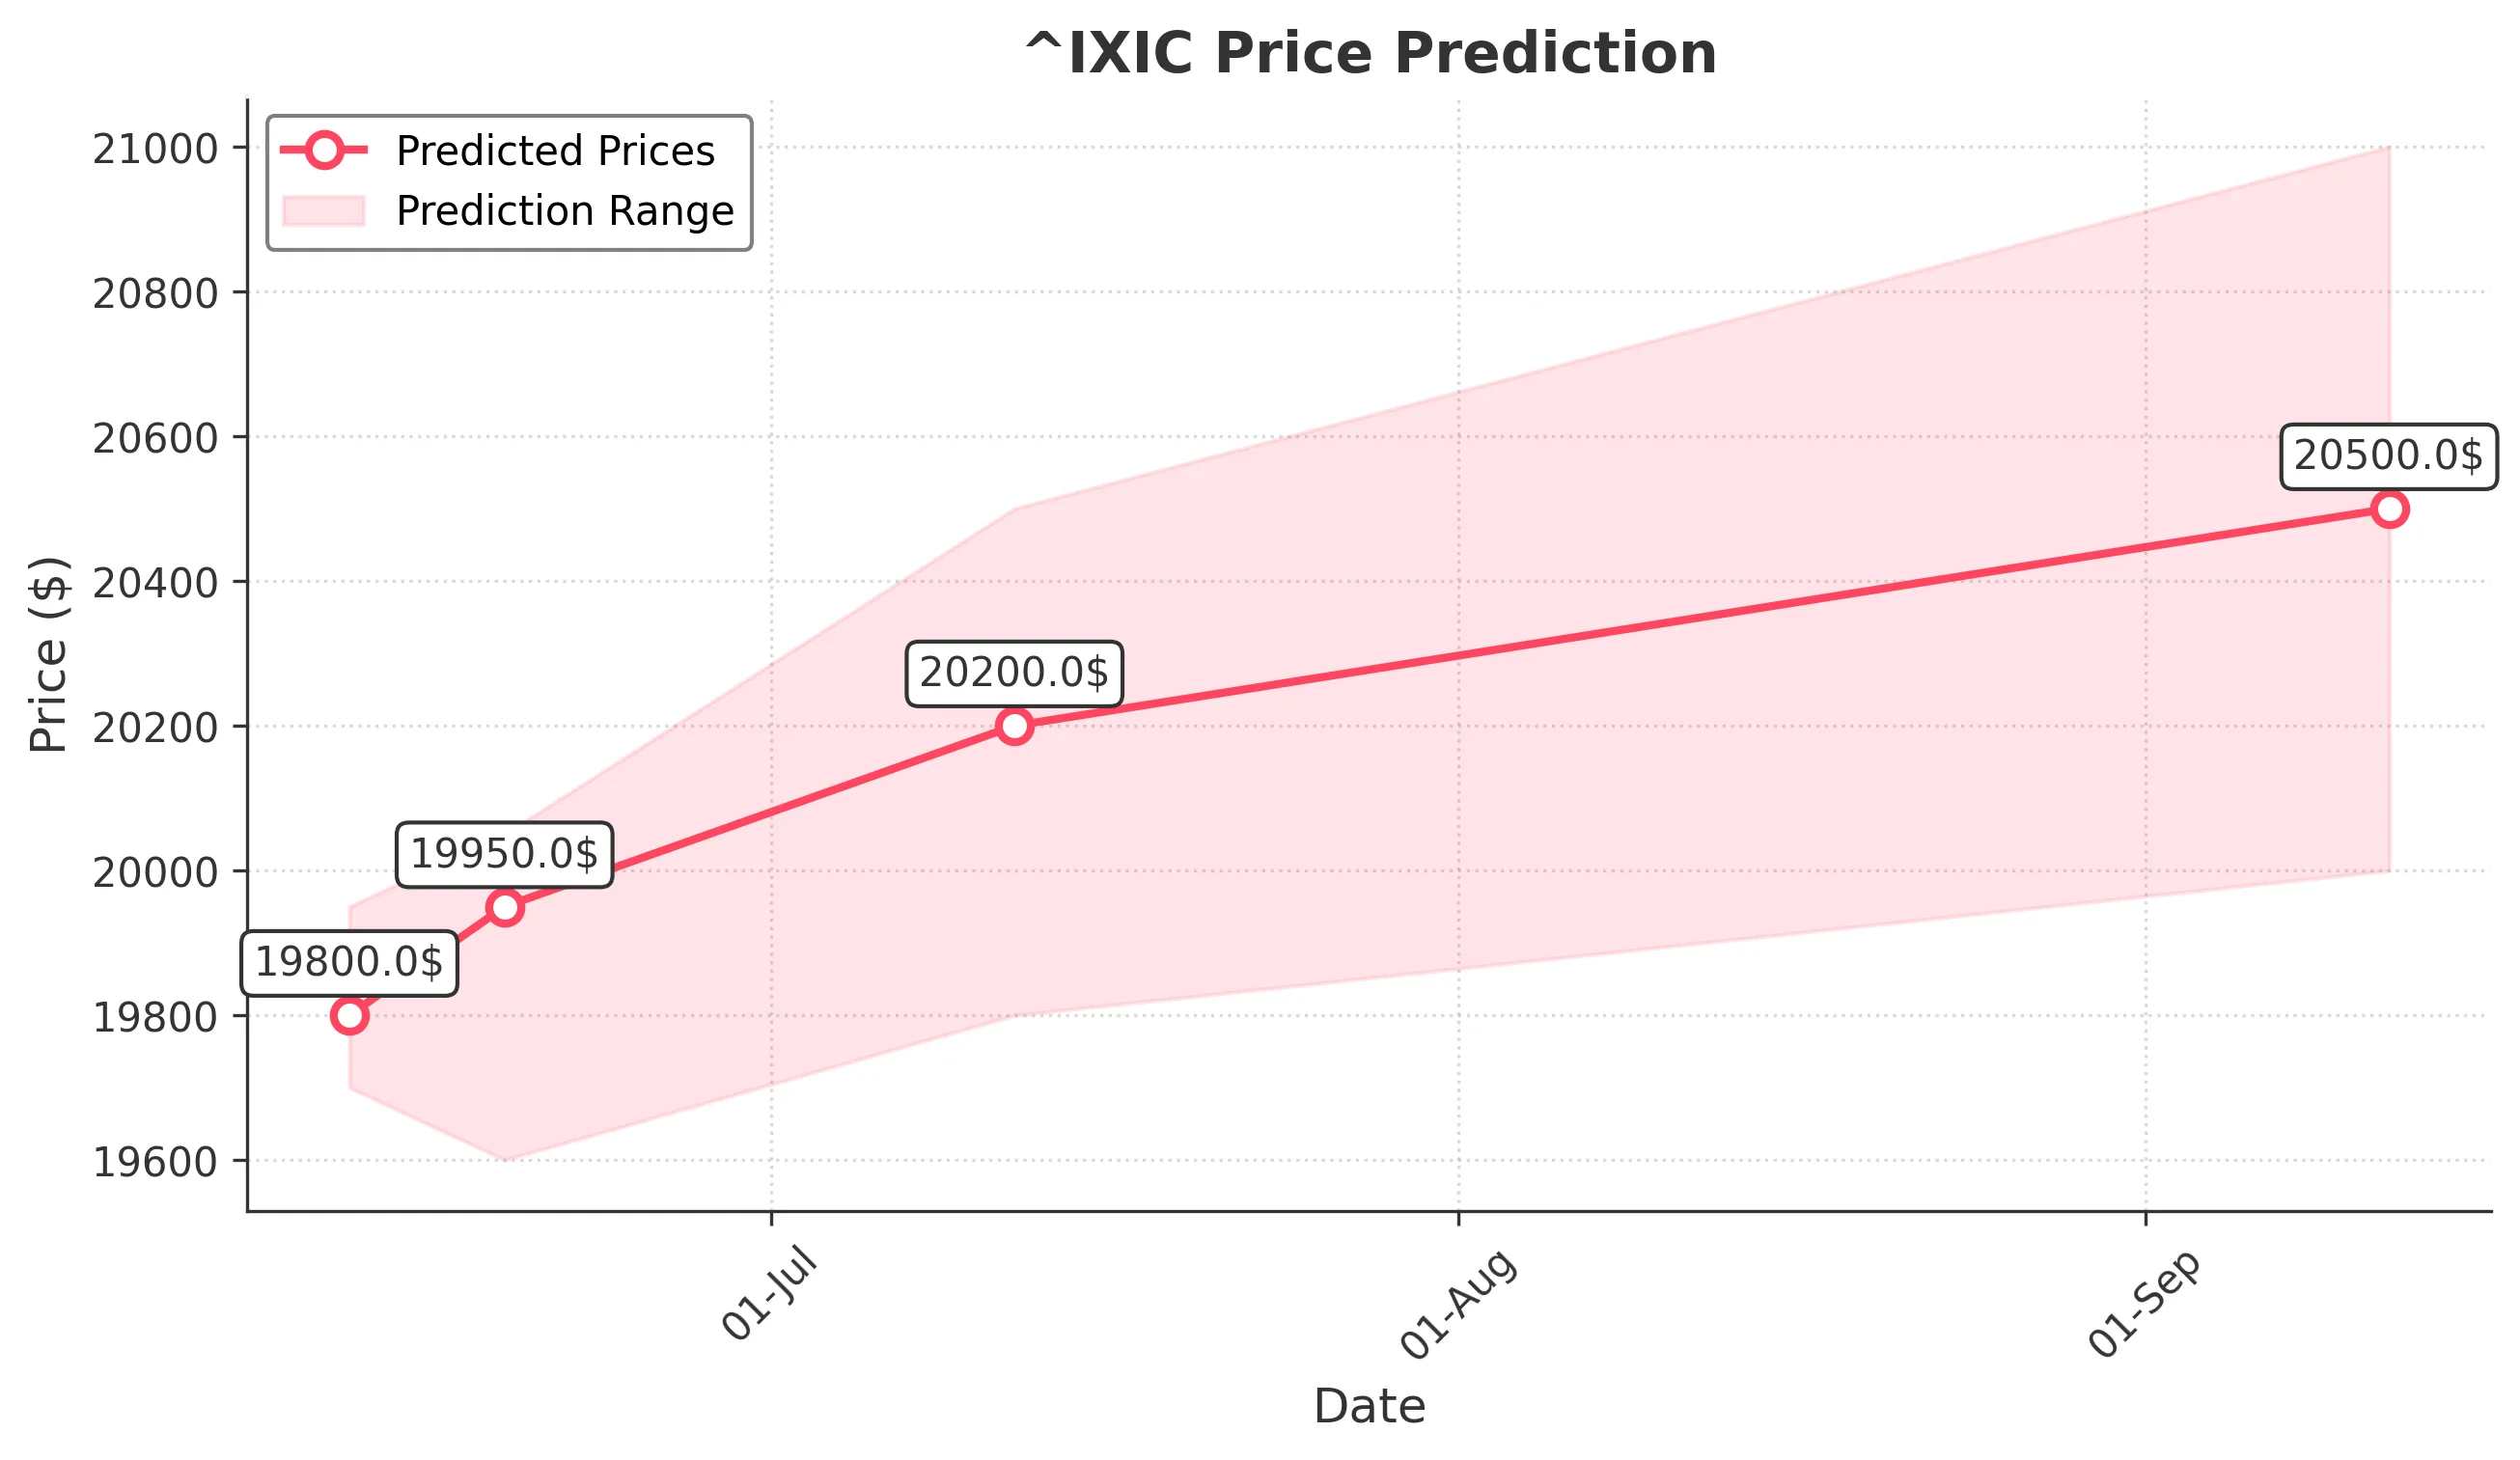
Target: June 12, 2025$19800
$19750
$19950
$19700
Description
The market shows bullish momentum with a recent upward trend. The RSI is approaching overbought levels, indicating potential for a pullback. However, strong volume and positive market sentiment suggest a close around 19800.
Analysis
The past 3 months show a bullish trend with significant support at 19000 and resistance at 20000. The MACD indicates upward momentum, while volume spikes suggest strong buying interest. Recent macroeconomic data supports growth, but caution is advised.
Confidence Level
Potential Risks
Potential for a pullback due to overbought RSI and market volatility.
1 Week Prediction
Target: June 19, 2025$19950
$19800
$20050
$19600
Description
The bullish trend is expected to continue, with the market likely to test the 20000 resistance level. The MACD remains positive, and the recent candlestick patterns indicate strong buying pressure.
Analysis
The index has shown resilience with a strong upward trajectory. Key support at 19500 and resistance at 20000 are critical. The ATR indicates increasing volatility, and the market sentiment remains optimistic despite potential external risks.
Confidence Level
Potential Risks
Market corrections could occur if economic data disappoints or if geopolitical tensions rise.
1 Month Prediction
Target: July 12, 2025$20200
$20000
$20500
$19800
Description
Expecting a bullish continuation as the index approaches the 20500 resistance. The Fibonacci retracement levels support this upward movement, although overbought conditions may lead to short-term corrections.
Analysis
The index has been on a strong upward trend, with significant support at 19500. The RSI is nearing overbought territory, suggesting caution. Volume trends indicate strong buying interest, but external economic factors could introduce volatility.
Confidence Level
Potential Risks
Economic indicators and earnings reports could impact market sentiment and lead to volatility.
3 Months Prediction
Target: September 12, 2025$20500
$20250
$21000
$20000
Description
Long-term bullish outlook as the index is expected to break through the 20500 resistance. Continued economic growth and positive earnings reports could drive prices higher, despite potential corrections.
Analysis
The index has shown a strong bullish trend, with key support at 20000. The MACD indicates potential upward momentum, but the market is sensitive to external factors. A balanced view is necessary as corrections may occur amidst overall growth.
Confidence Level
Potential Risks
Unforeseen economic downturns or geopolitical events could reverse the trend.