NSDQ Trading Predictions
1 Day Prediction
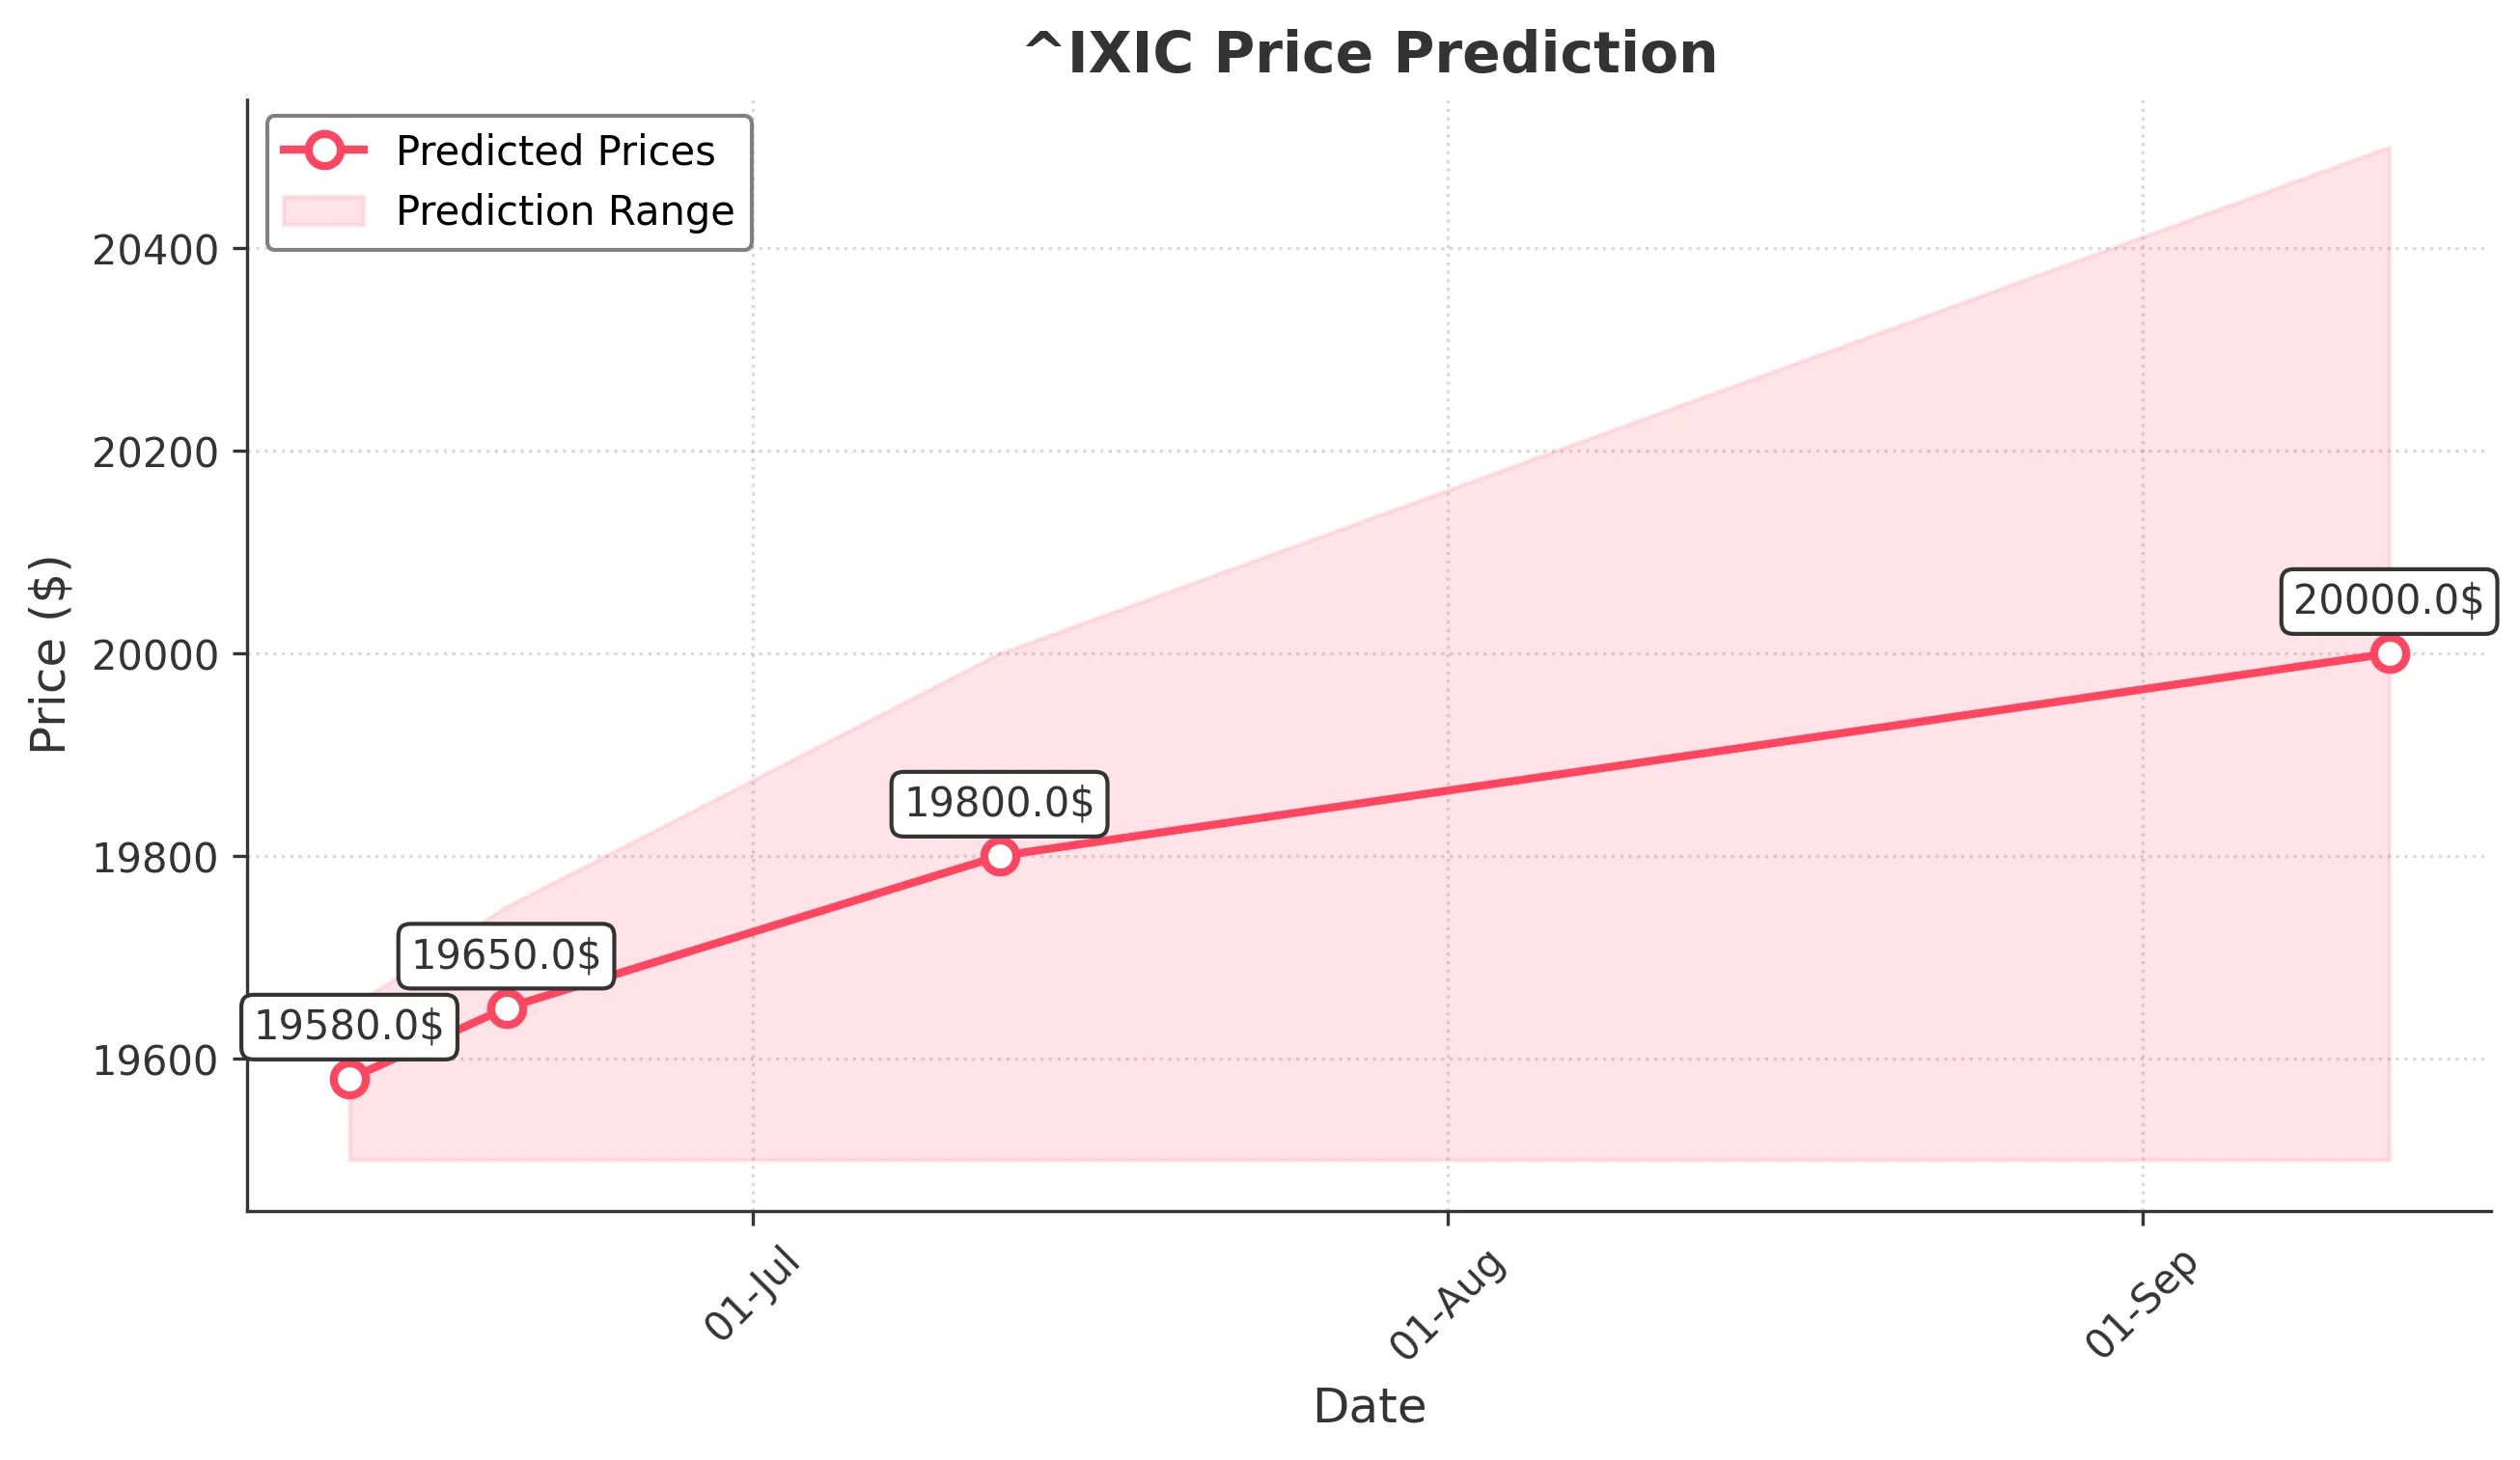
Target: June 13, 2025$19580
$19600
$19650
$19500
Description
The market shows a slight bullish trend with a recent Doji candlestick indicating indecision. RSI is neutral, and MACD is close to crossing above the signal line, suggesting potential upward momentum. Volume remains steady, supporting the prediction.
Analysis
Over the past 3 months, ^IXIC has shown a bullish trend with significant support at 19500. Recent price action indicates a potential consolidation phase. Technical indicators like moving averages are bullish, but RSI suggests caution. Volume patterns indicate healthy trading activity.
Confidence Level
Potential Risks
Market volatility and external news could impact the prediction. A sudden downturn in sentiment may lead to a price drop.
1 Week Prediction
Target: June 20, 2025$19650
$19620
$19750
$19500
Description
The bullish trend is expected to continue as the MACD shows a positive divergence. The price is approaching a Fibonacci retracement level, which may act as a support. However, the RSI is nearing overbought territory, indicating potential pullbacks.
Analysis
The index has been on an upward trajectory, with key resistance at 19750. The recent bullish candlestick patterns and increasing volume suggest strong buying interest. However, the market remains sensitive to macroeconomic factors.
Confidence Level
Potential Risks
Potential market corrections or negative news could reverse the trend. Watch for any significant economic announcements.
1 Month Prediction
Target: July 12, 2025$19800
$19700
$20000
$19500
Description
The market is expected to maintain its bullish momentum, with the MACD indicating a strong upward trend. The RSI may remain elevated, suggesting a potential for overbought conditions. Volume is expected to support the upward movement.
Analysis
The past three months have shown a strong bullish trend, with significant support at 19500. The index has broken through previous resistance levels, and technical indicators support continued upward movement. However, caution is warranted due to potential overbought conditions.
Confidence Level
Potential Risks
Economic data releases and geopolitical events could introduce volatility. A correction may occur if the RSI remains overbought for too long.
3 Months Prediction
Target: September 12, 2025$20000
$19900
$20500
$19500
Description
The index is projected to reach new highs as bullish sentiment persists. The MACD and moving averages indicate a strong upward trend. However, the RSI may signal overbought conditions, suggesting a potential pullback.
Analysis
The overall performance has been bullish, with key resistance at 20500. The index has shown resilience, but potential overbought conditions and external economic influences could lead to volatility. A balanced view is necessary as the market evolves.
Confidence Level
Potential Risks
Market corrections and external economic factors could impact the forecast. A significant downturn in sentiment could lead to a price decline.