NSDQ Trading Predictions
1 Day Prediction
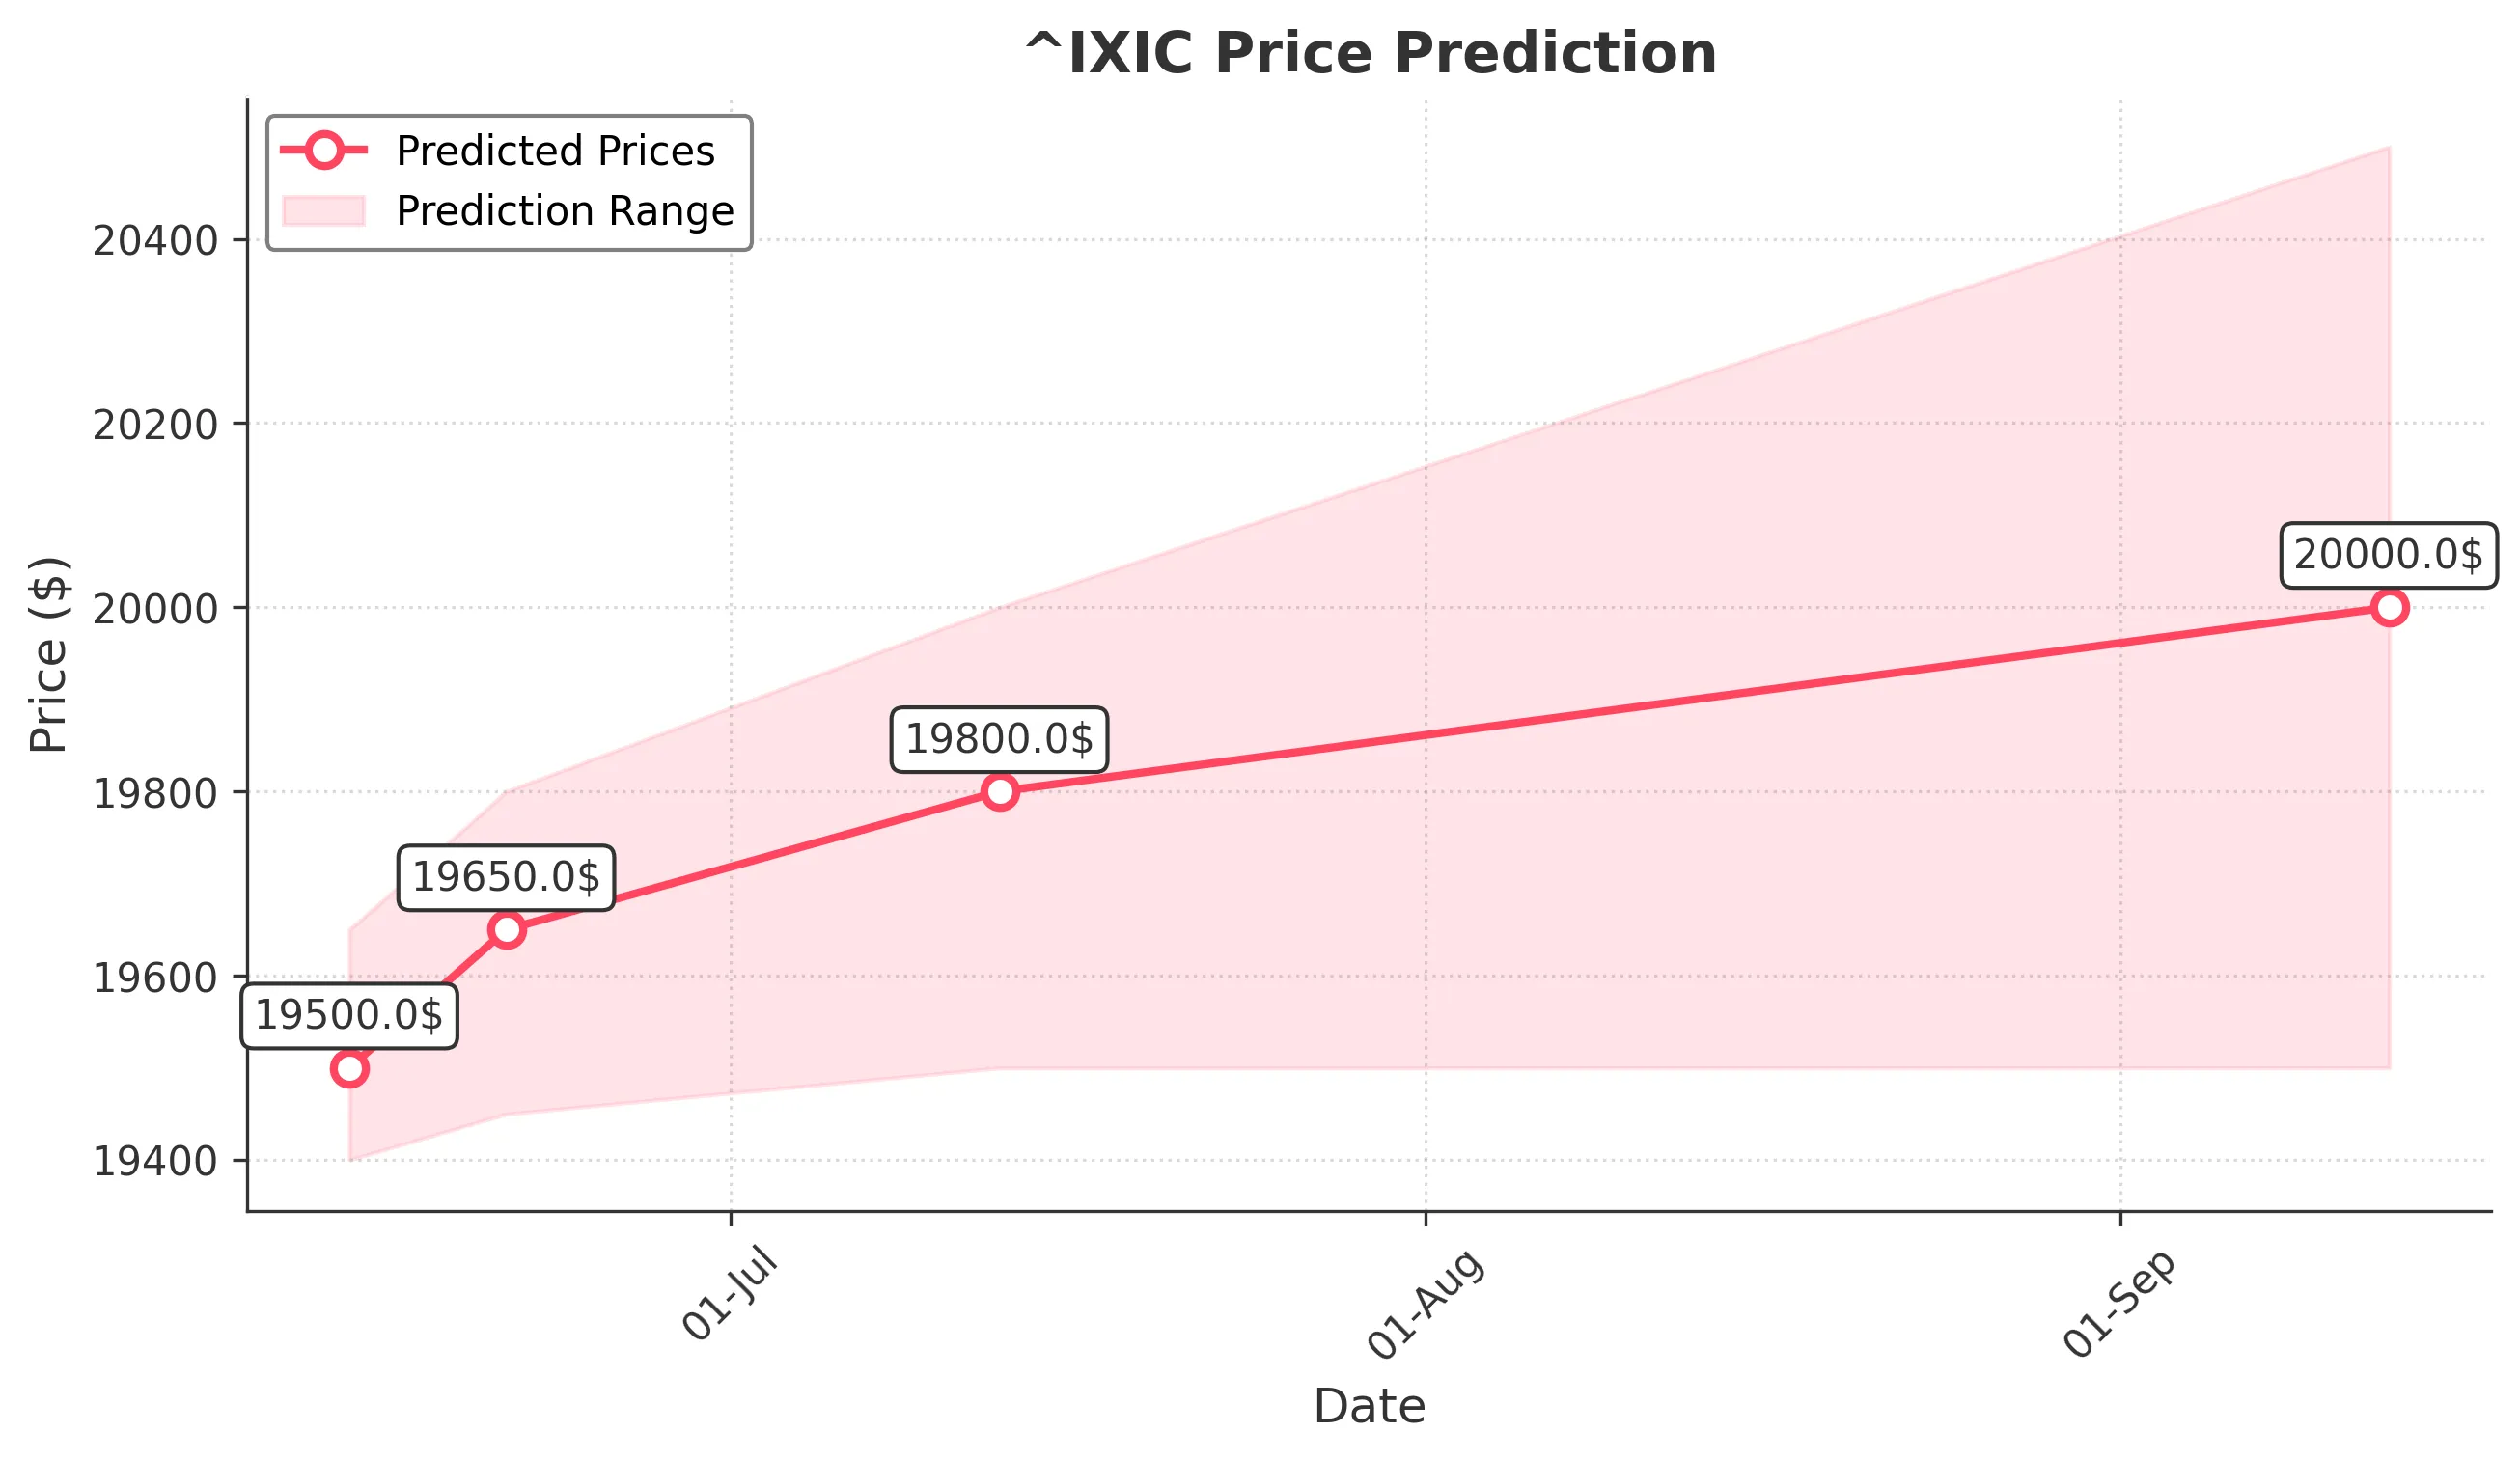
Target: June 14, 2025$19500
$19550
$19650
$19400
Description
The market shows a slight bullish trend with a recent Doji candlestick indicating indecision. RSI is neutral, and MACD is close to crossing above the signal line, suggesting potential upward momentum. However, volatility remains high.
Analysis
Over the past 3 months, ^IXIC has shown a bullish trend with significant support at 19400. Recent volume spikes indicate strong interest, but the market is also facing resistance around 19700. Technical indicators suggest potential for further gains, but caution is warranted due to volatility.
Confidence Level
Potential Risks
Market sentiment could shift due to external news or economic data releases, which may impact trading volume and price direction.
1 Week Prediction
Target: June 21, 2025$19650
$19575
$19800
$19450
Description
The bullish momentum is expected to continue, supported by a recent upward trend in moving averages. The MACD indicates potential upward movement, while RSI remains stable. However, market volatility could lead to fluctuations.
Analysis
The index has been trending upward, with key support at 19500 and resistance at 19800. The recent bullish candlestick patterns and increasing volume suggest strong buying interest, but external factors could introduce volatility.
Confidence Level
Potential Risks
Potential market corrections or negative news could impact the predicted upward trend, leading to unexpected price movements.
1 Month Prediction
Target: July 13, 2025$19800
$19700
$20000
$19500
Description
The market is expected to maintain a bullish trend, with strong support at 19500 and resistance at 20000. The MACD is bullish, and RSI indicates strength. However, external economic factors could introduce volatility.
Analysis
The past three months have shown a strong upward trend, with significant volume increases. Key resistance levels are being tested, and while the outlook is bullish, caution is advised due to potential market corrections.
Confidence Level
Potential Risks
Economic data releases or geopolitical events could lead to market corrections, impacting the predicted price trajectory.
3 Months Prediction
Target: September 13, 2025$20000
$19900
$20500
$19500
Description
The index is projected to reach 20000, supported by strong bullish momentum and positive market sentiment. However, potential economic downturns or unexpected news could lead to volatility.
Analysis
The overall trend has been bullish, with significant support at 19500 and resistance at 20500. While technical indicators suggest continued upward movement, external factors could introduce volatility and impact the index's performance.
Confidence Level
Potential Risks
Long-term predictions are subject to greater uncertainty due to potential economic shifts, market corrections, or unforeseen events.