NSDQ Trading Predictions
1 Day Prediction
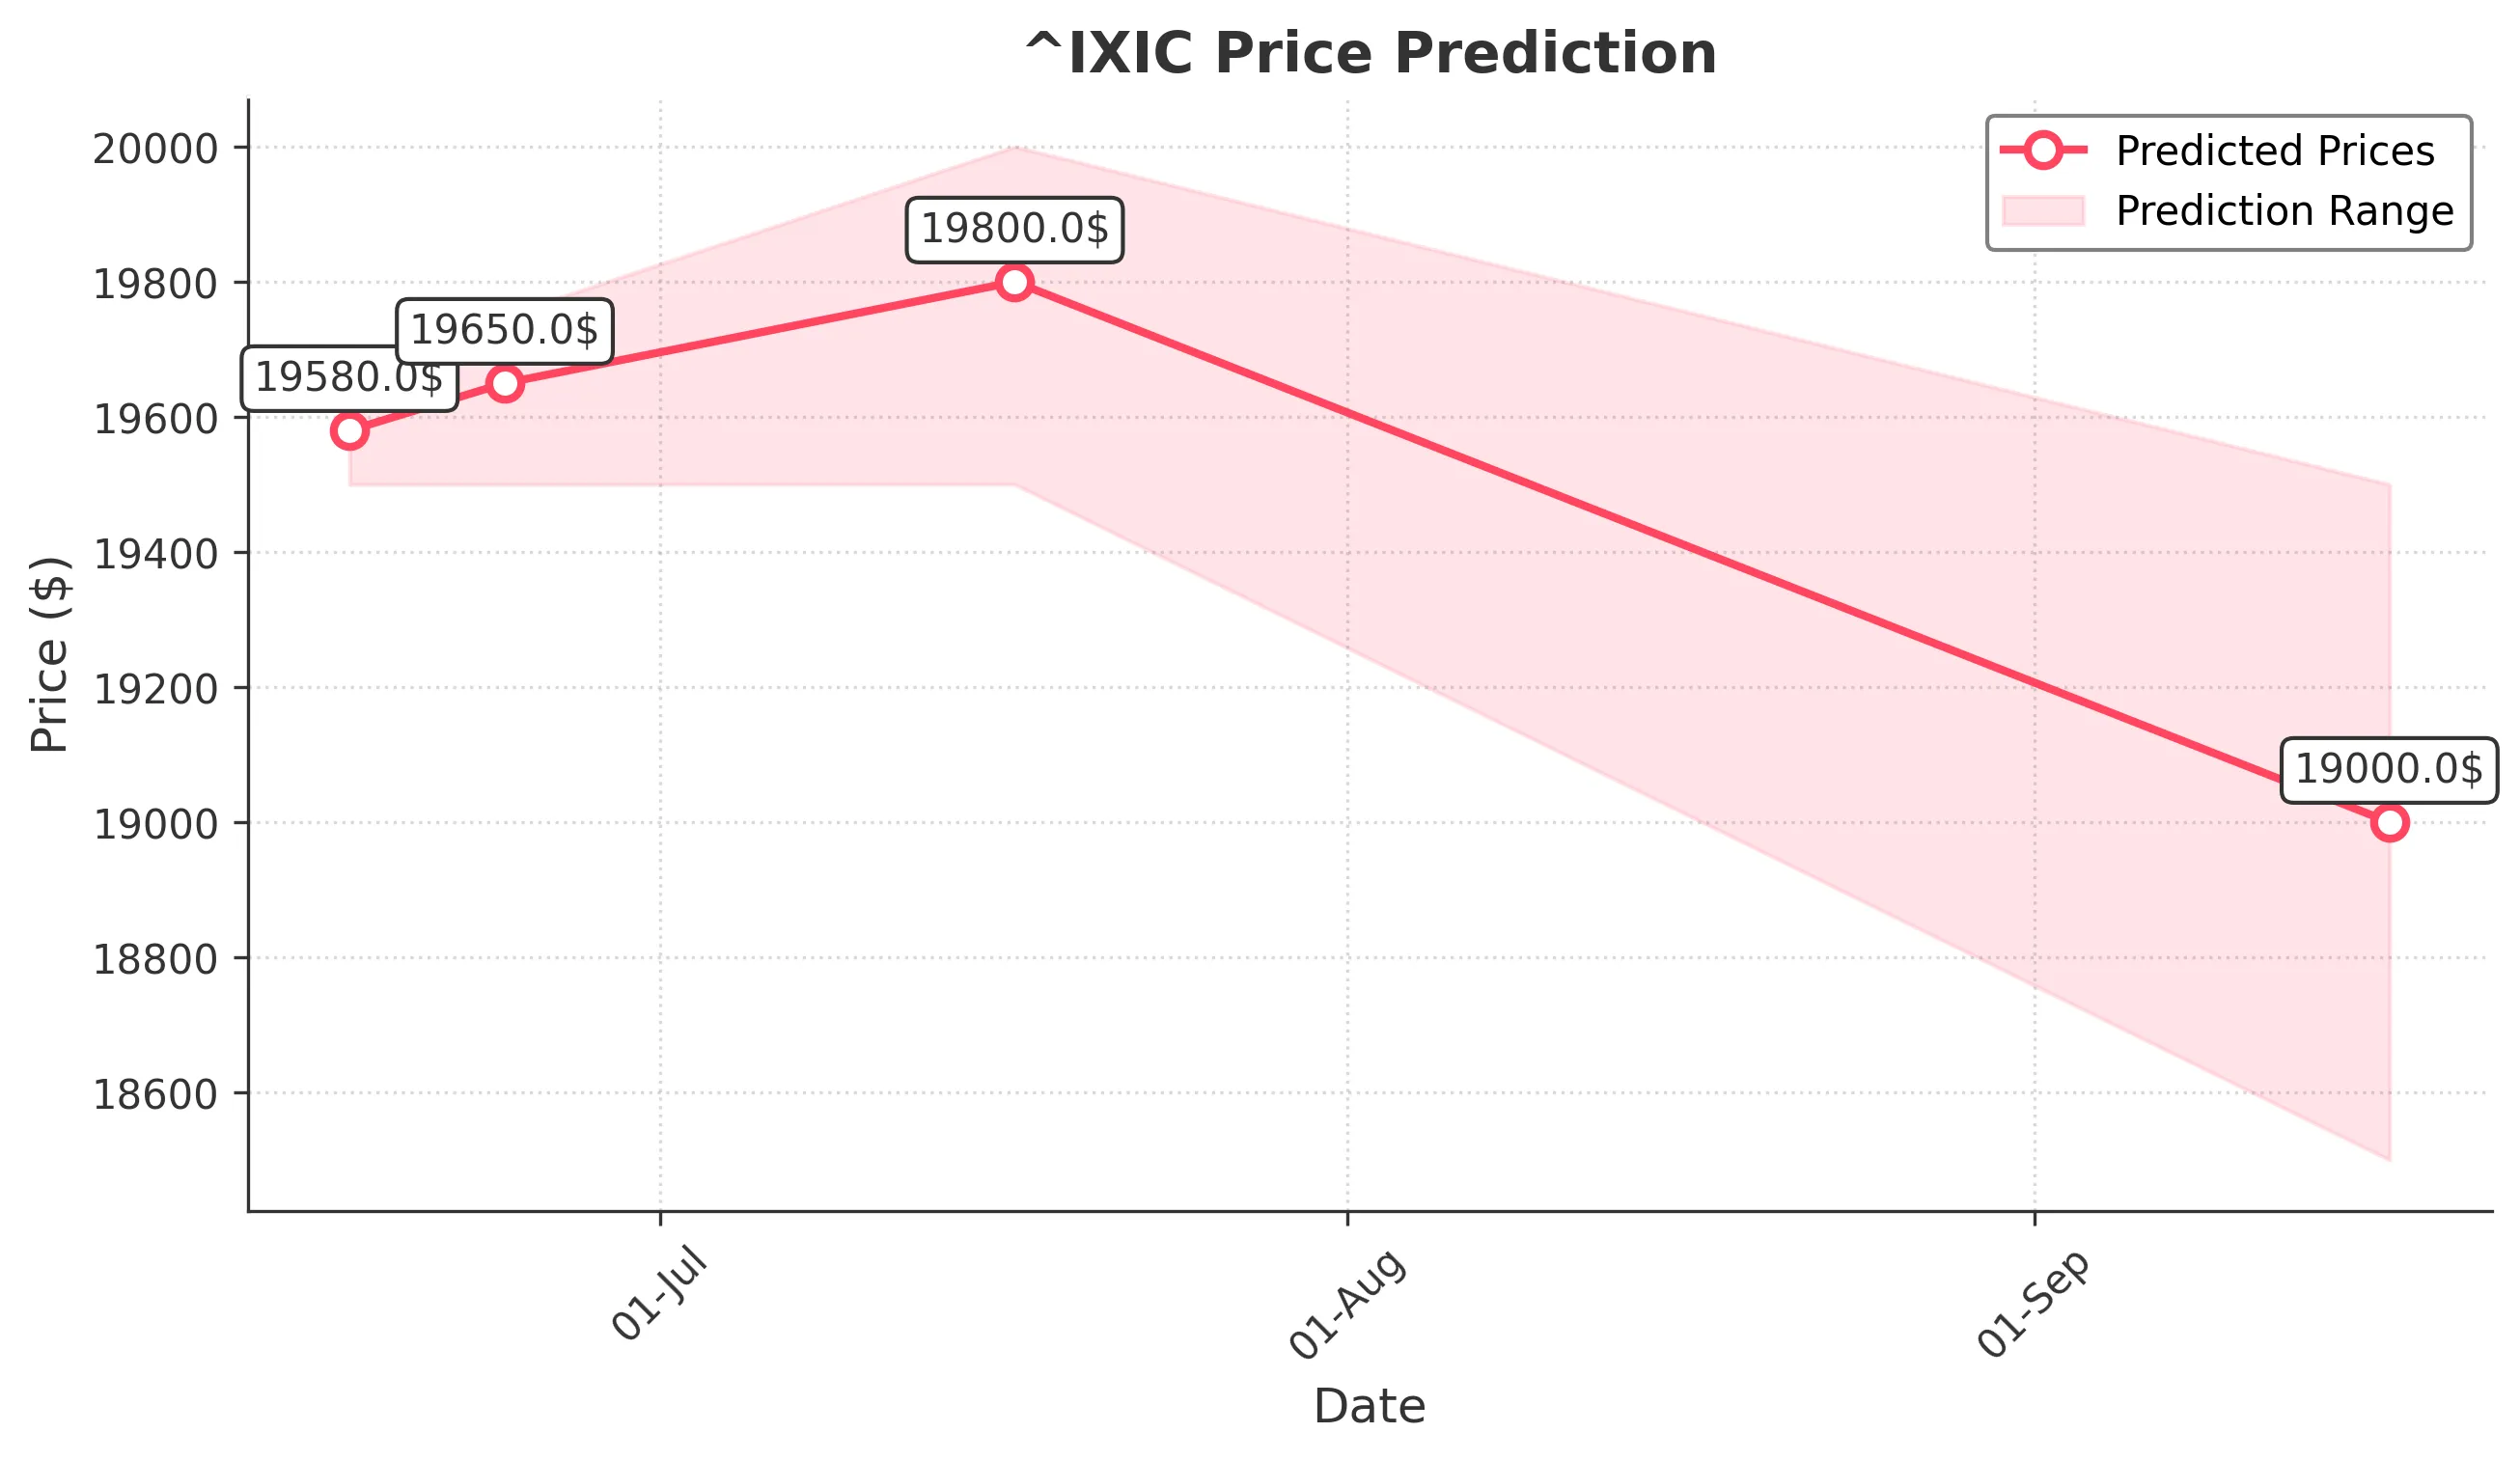
Target: June 17, 2025$19580
$19570
$19650
$19500
Description
The market shows bullish momentum with a recent upward trend. The RSI is near 60, indicating strength, while MACD is positive. A Doji pattern suggests indecision, but overall sentiment remains bullish. Expect slight volatility.
Analysis
The past 3 months show a bullish trend with significant support at 19500. Recent volume spikes indicate strong buying interest. Technical indicators like moving averages confirm upward momentum, but caution is advised due to potential market corrections.
Confidence Level
Potential Risks
Potential for a pullback exists if market sentiment shifts or external news impacts trading.
1 Week Prediction
Target: June 24, 2025$19650
$19600
$19750
$19500
Description
The bullish trend is expected to continue, supported by strong volume and positive MACD. However, the RSI nearing overbought levels may lead to a correction. Watch for resistance at 19750.
Analysis
The stock has shown resilience with a clear upward trajectory. Key resistance at 19750 may pose challenges. Volume analysis indicates strong interest, but the market's reaction to macroeconomic news could introduce uncertainty.
Confidence Level
Potential Risks
Market volatility and external economic factors could impact this prediction, especially if profit-taking occurs.
1 Month Prediction
Target: July 17, 2025$19800
$19700
$20000
$19500
Description
Continued bullish sentiment is expected, with potential for reaching 20000. The MACD remains positive, and the RSI is stabilizing. However, watch for signs of exhaustion as the price approaches key resistance.
Analysis
The stock has maintained a bullish trend, with significant support at 19500. Technical indicators suggest further upside potential, but caution is warranted as the market approaches historical highs, which may trigger profit-taking.
Confidence Level
Potential Risks
Economic indicators and geopolitical events could lead to unexpected volatility, impacting the forecast.
3 Months Prediction
Target: September 17, 2025$19000
$19200
$19500
$18500
Description
A potential bearish reversal is anticipated as the market may face resistance at higher levels. The RSI indicates overbought conditions, and profit-taking could lead to a decline. Monitor for signs of a trend reversal.
Analysis
The stock has shown strong performance, but signs of exhaustion are emerging. Key resistance levels may trigger profit-taking, leading to a potential decline. The market's reaction to macroeconomic data will be crucial in determining future direction.
Confidence Level
Potential Risks
Unforeseen economic events or shifts in market sentiment could significantly alter this outlook, leading to increased volatility.