NSDQ Trading Predictions
1 Day Prediction
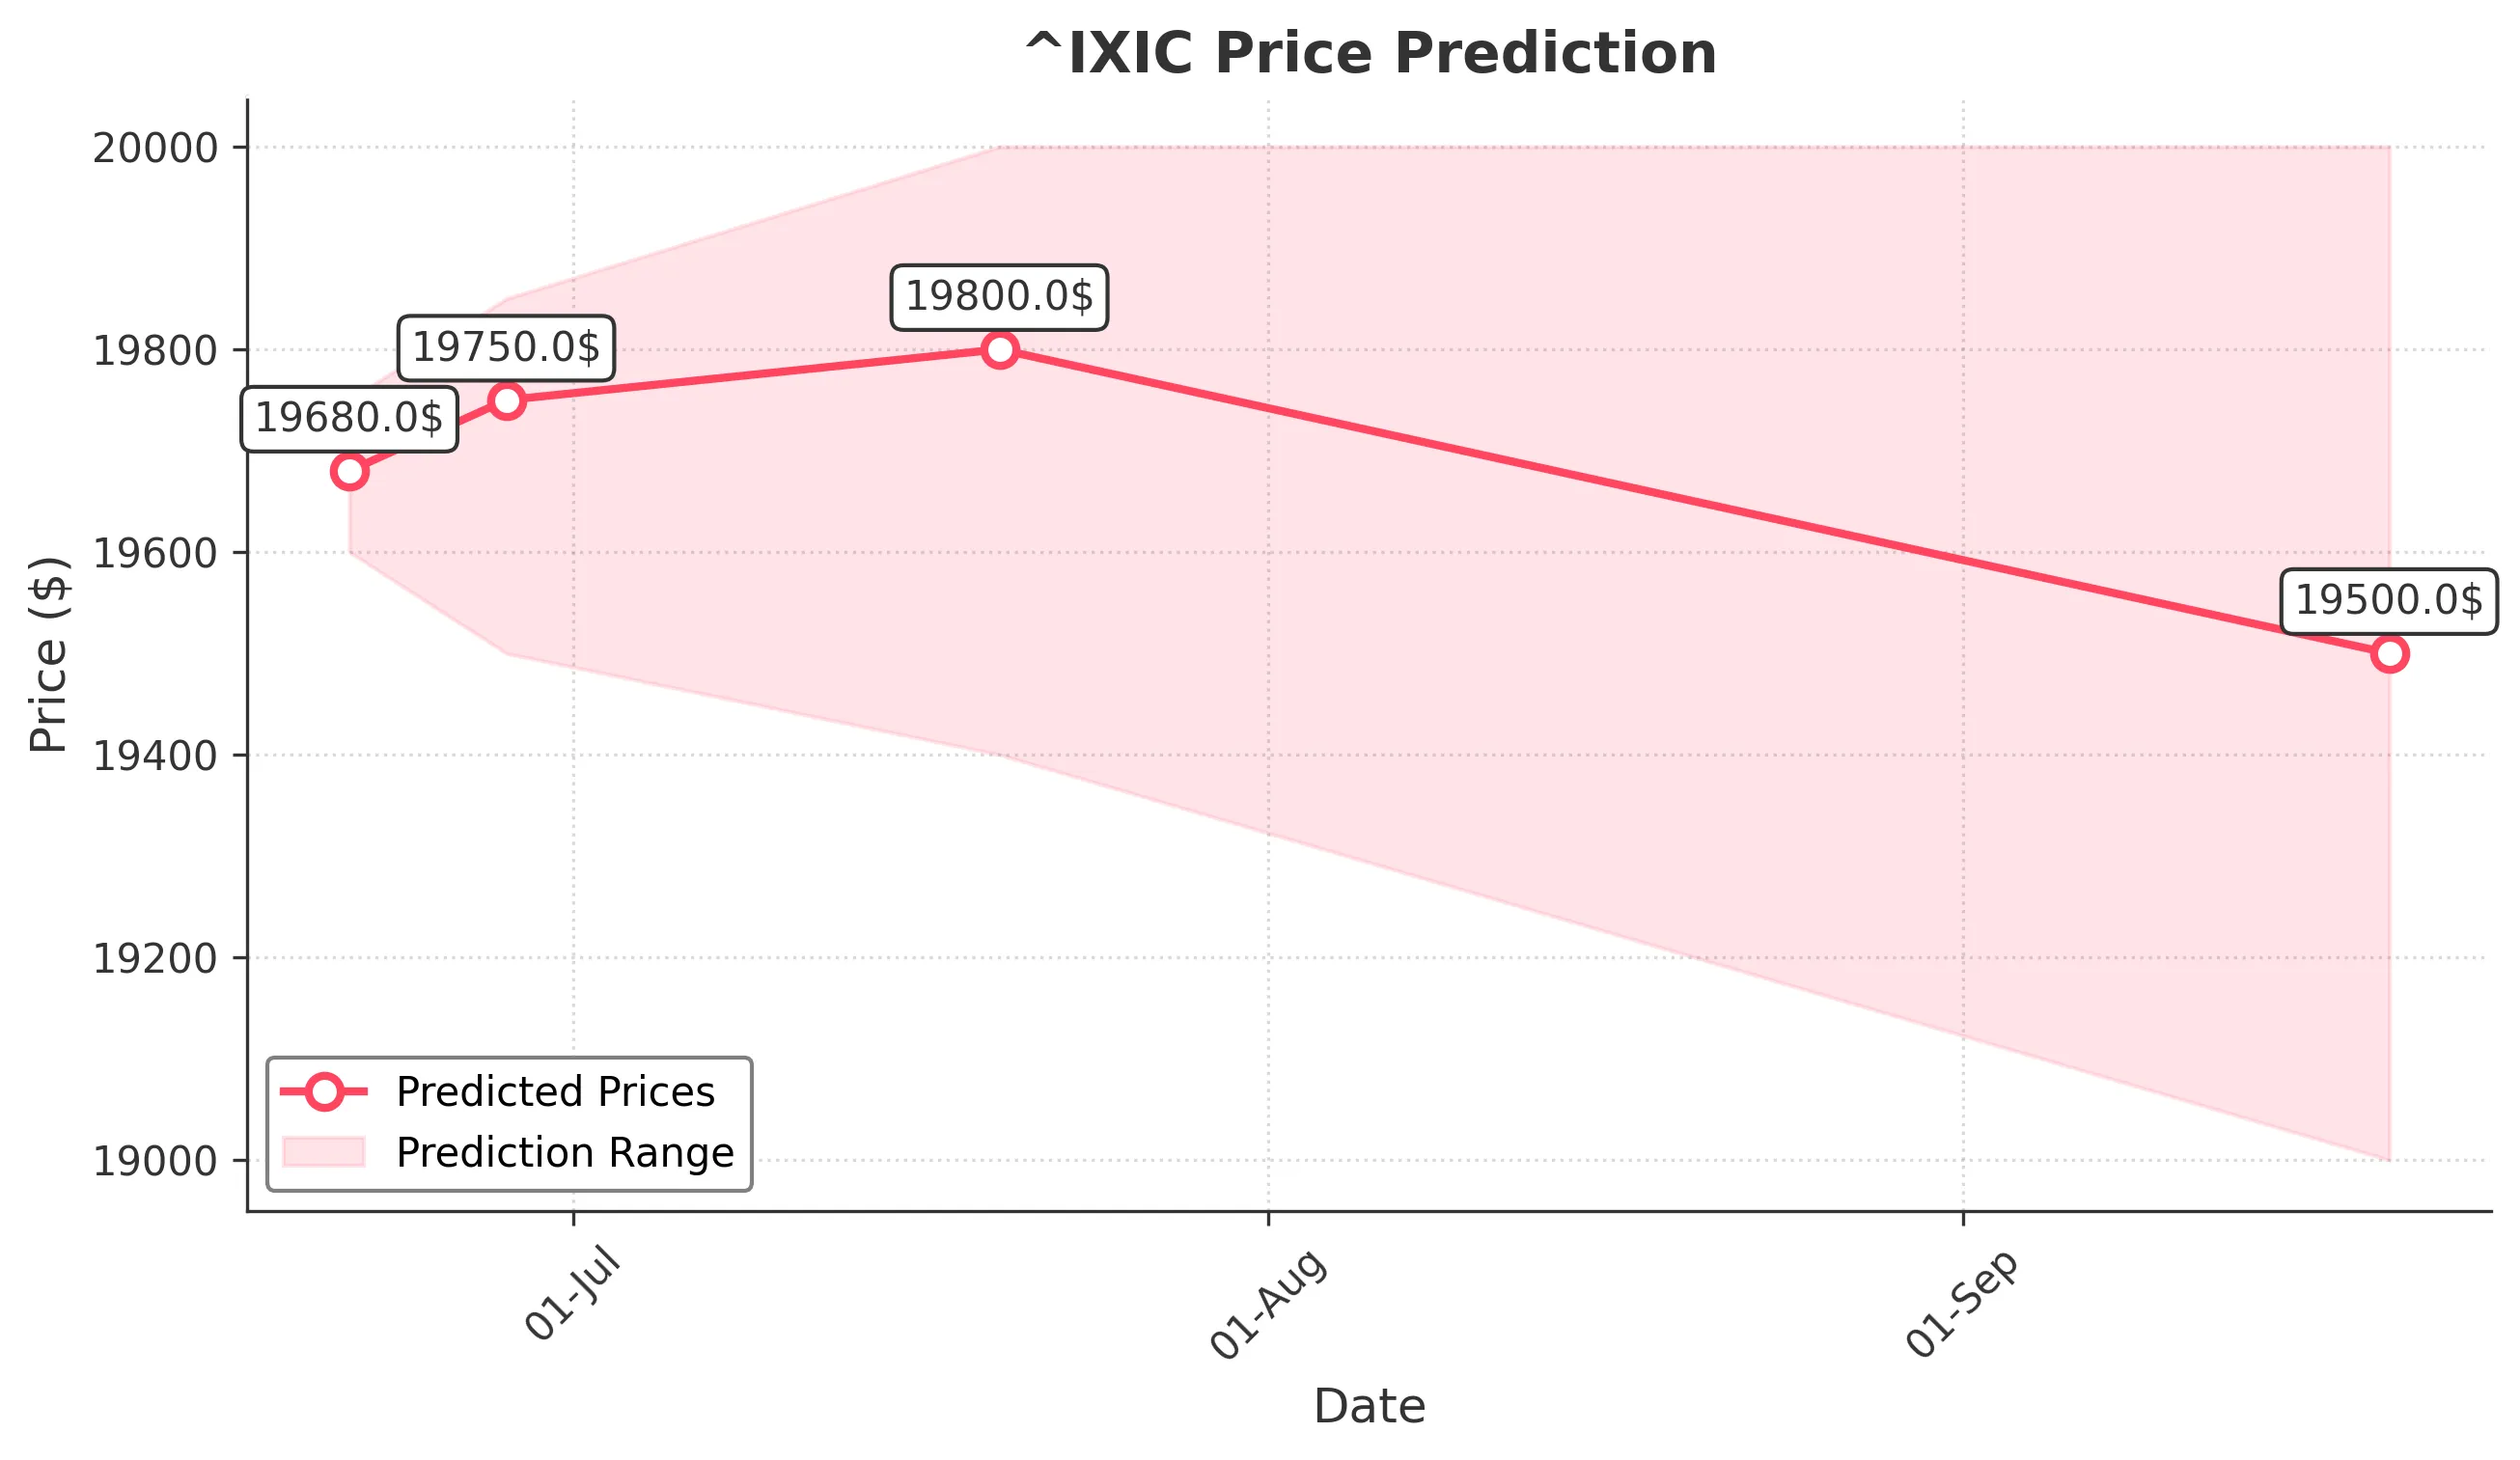
Target: June 21, 2025$19680
$19650
$19750
$19600
Description
The market shows bullish momentum with a recent upward trend. The RSI is approaching overbought levels, indicating potential for a pullback. However, strong support at 19600 may hold. Volume remains steady, suggesting continued interest.
Analysis
Over the past 3 months, ^IXIC has shown a bullish trend with significant upward movements. Key support is at 19600, while resistance is around 19750. The MACD indicates bullish momentum, but the RSI suggests caution as it nears overbought territory.
Confidence Level
Potential Risks
Potential for a reversal exists if market sentiment shifts or if macroeconomic news impacts trading.
1 Week Prediction
Target: June 28, 2025$19750
$19680
$19850
$19500
Description
The bullish trend is expected to continue, with the market likely to test resistance at 19850. However, the RSI indicates overbought conditions, suggesting a possible pullback. Volume trends remain strong, supporting upward movement.
Analysis
The index has been on a bullish trajectory, with strong support at 19600. The MACD remains positive, indicating upward momentum. However, the RSI nearing overbought levels raises concerns about potential corrections.
Confidence Level
Potential Risks
Market volatility and external economic factors could lead to unexpected price movements.
1 Month Prediction
Target: July 20, 2025$19800
$19750
$20000
$19400
Description
The market is expected to maintain its bullish trend, potentially reaching 20000. However, the RSI suggests caution as it approaches overbought levels. A correction could occur if market sentiment shifts.
Analysis
The past three months have shown a strong upward trend, with key resistance at 20000. The MACD supports continued bullish momentum, but the RSI indicates potential overextension. Volume patterns suggest sustained interest, but caution is warranted.
Confidence Level
Potential Risks
Economic data releases and geopolitical events could impact market stability and lead to volatility.
3 Months Prediction
Target: September 20, 2025$19500
$19800
$20000
$19000
Description
Expect fluctuations with potential for a pullback to 19500 as the market adjusts. The RSI indicates overbought conditions, and macroeconomic factors may influence sentiment. Watch for support at 19000.
Analysis
The index has shown strong bullish trends, but the potential for a correction looms as the RSI indicates overbought conditions. Key support at 19000 may be tested, and external economic factors could introduce volatility.
Confidence Level
Potential Risks
Unforeseen economic events or shifts in market sentiment could lead to significant volatility.