NSDQ Trading Predictions
1 Day Prediction
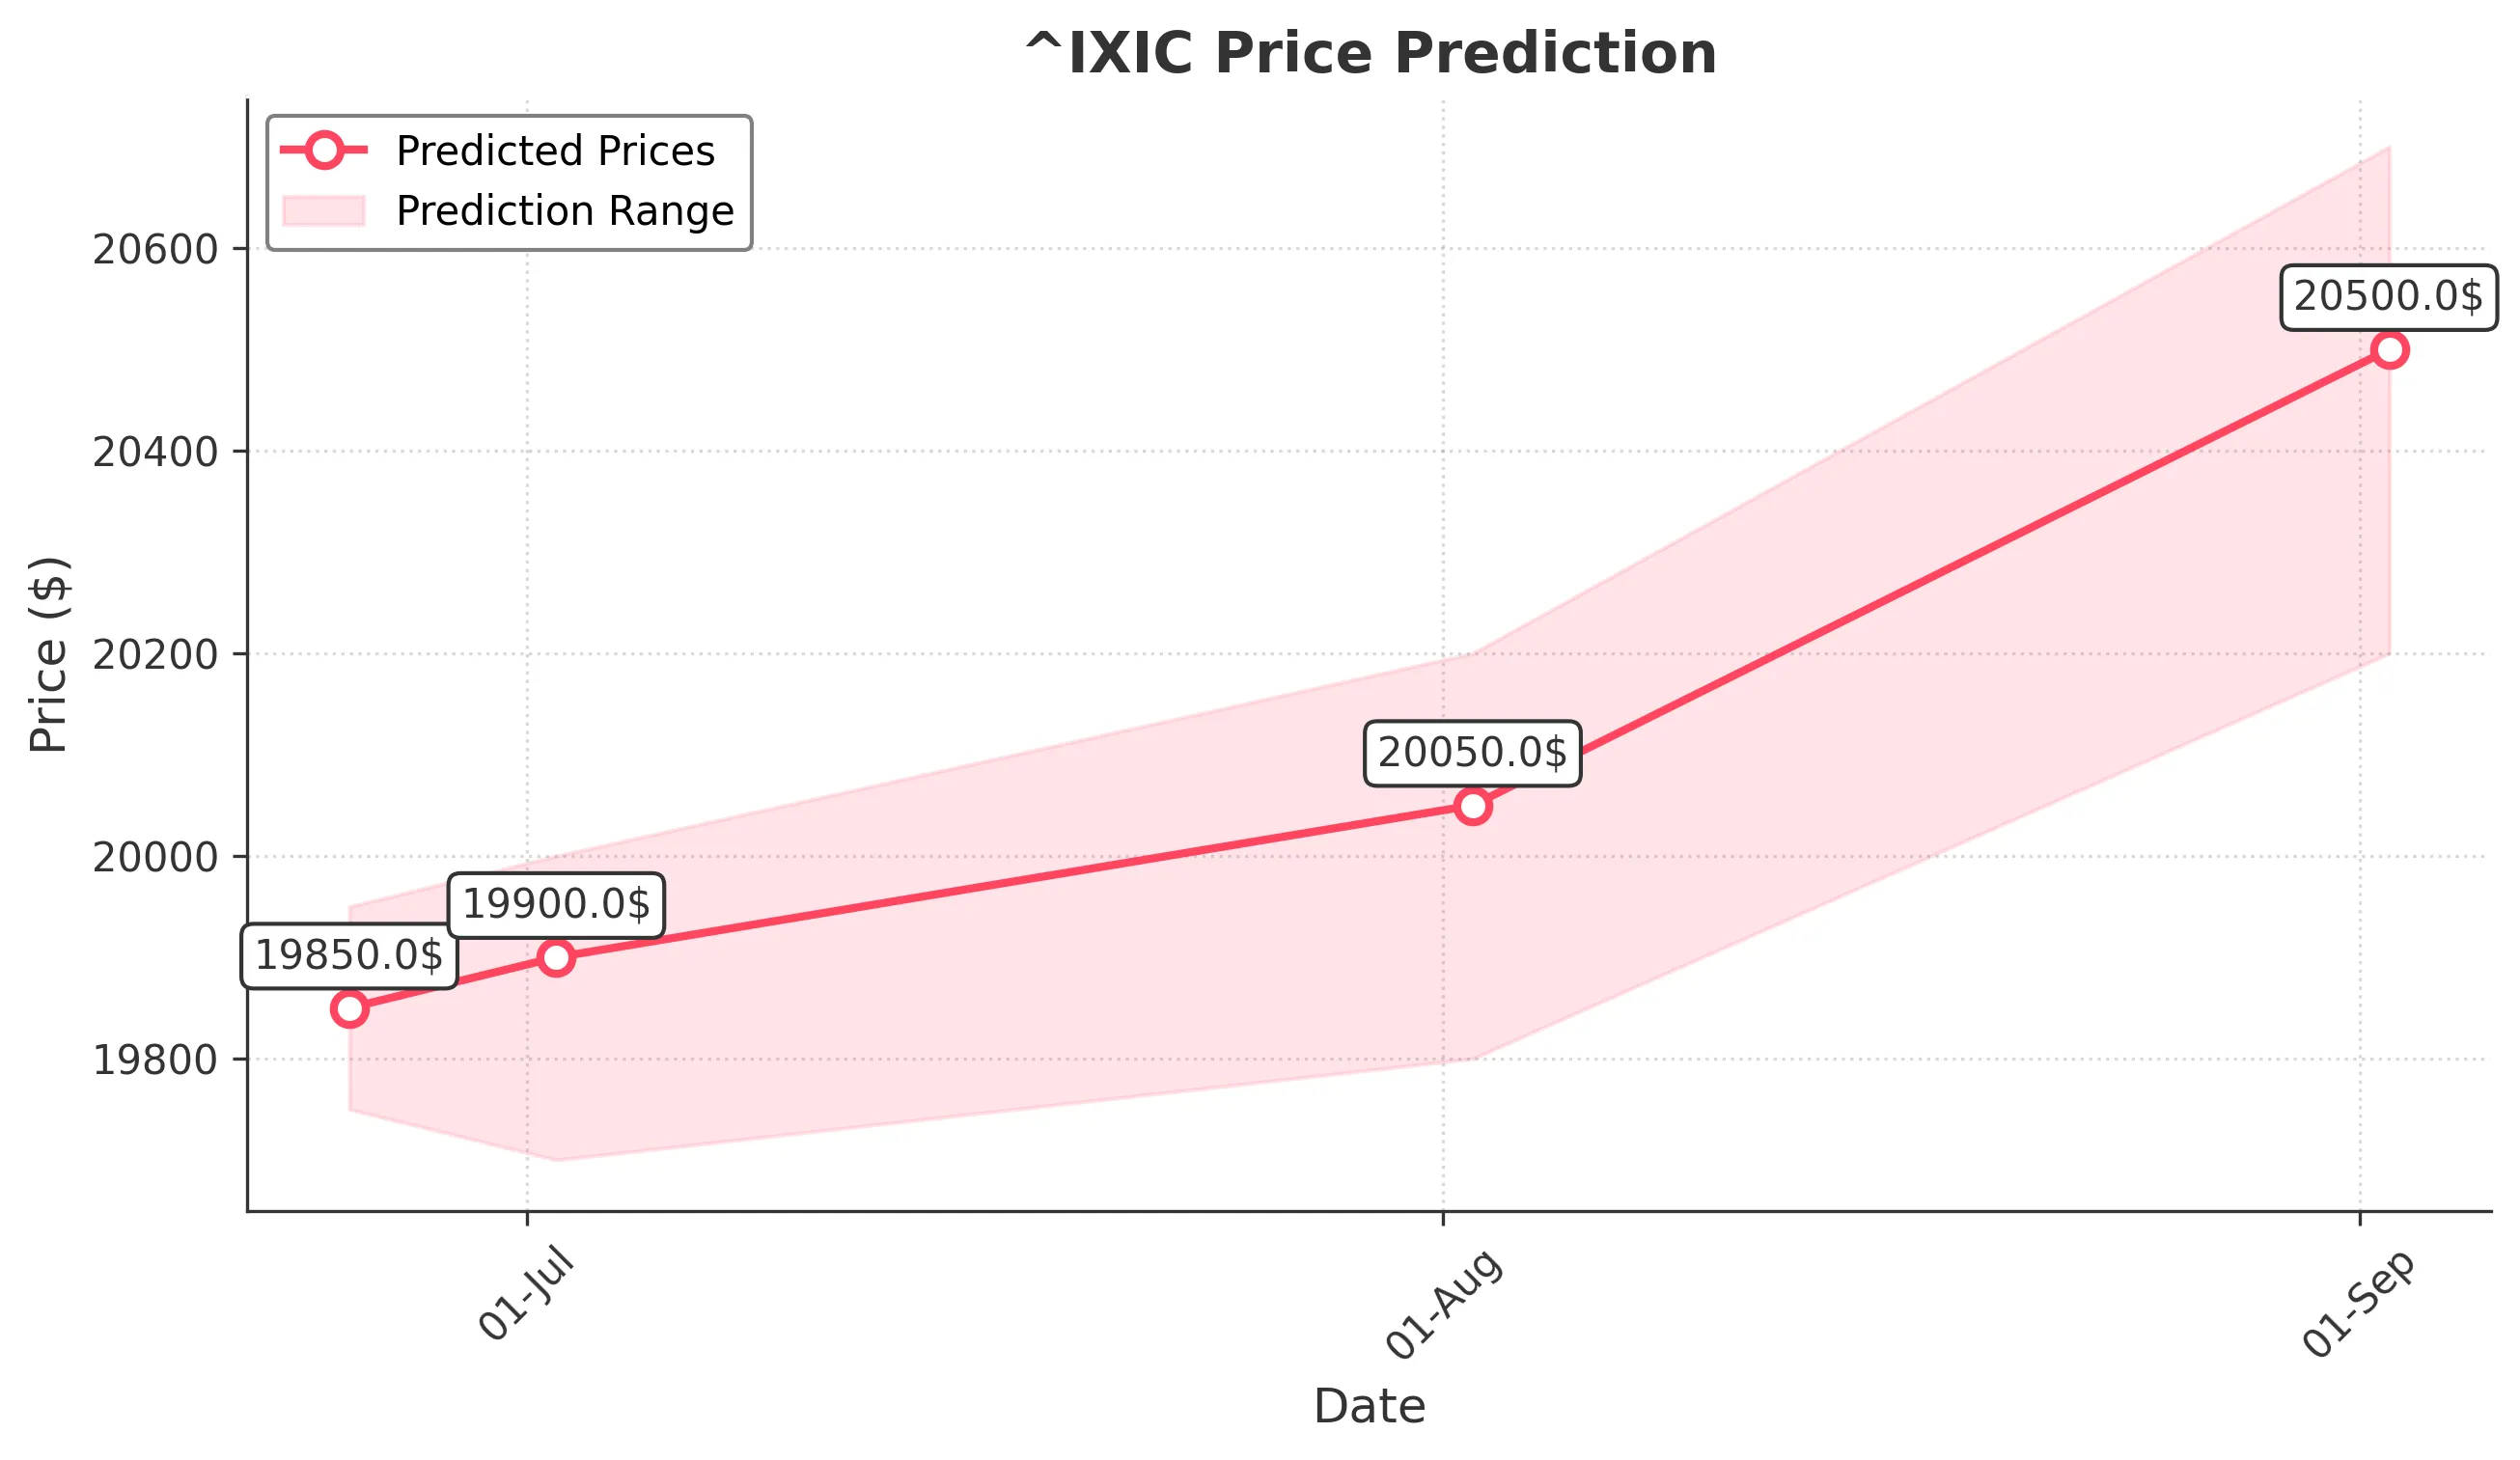
Target: June 25, 2025$19850
$19800
$19950
$19750
Description
The market shows bullish momentum with a recent upward trend. The RSI is approaching overbought levels, indicating potential for a pullback. However, strong volume suggests continued interest. Expect a close around 19850.
Analysis
The past 3 months show a bullish trend with significant support at 19500. Recent volume spikes indicate strong buying interest. However, the RSI nearing overbought levels and recent candlestick patterns suggest caution.
Confidence Level
Potential Risks
Potential for a pullback due to overbought RSI and market volatility.
1 Week Prediction
Target: July 2, 2025$19900
$19850
$20000
$19700
Description
The bullish trend is expected to continue, with the MACD showing positive momentum. However, the market may face resistance around 20000. Anticipate a close at 19900 as traders take profits.
Analysis
The stock has shown strong upward movement, with key support at 19500. The MACD is bullish, but the RSI indicates potential overbought conditions. Volume remains robust, but profit-taking could introduce volatility.
Confidence Level
Potential Risks
Resistance at 20000 could trigger profit-taking, leading to volatility.
1 Month Prediction
Target: August 2, 2025$20050
$19950
$20200
$19800
Description
Expect continued bullish momentum as the market breaks through resistance levels. The Fibonacci retracement suggests a target around 20050. However, watch for potential corrections.
Analysis
The stock has been in a strong uptrend, with significant resistance at 20000. The MACD remains bullish, but the RSI indicates overbought conditions. Volume patterns suggest strong interest, but corrections are possible.
Confidence Level
Potential Risks
Market corrections could occur if the RSI remains overbought.
3 Months Prediction
Target: September 2, 2025$20500
$20400
$20700
$20200
Description
Long-term bullish sentiment is expected as the market continues to rally. The overall trend remains strong, but watch for potential pullbacks as the market approaches new highs.
Analysis
The stock has shown a consistent upward trend, with key support at 20000. The MACD remains positive, but the RSI indicates potential overbought conditions. Volume trends suggest strong interest, but external factors could introduce volatility.
Confidence Level
Potential Risks
Unforeseen macroeconomic events could impact market stability.