NSDQ Trading Predictions
1 Day Prediction
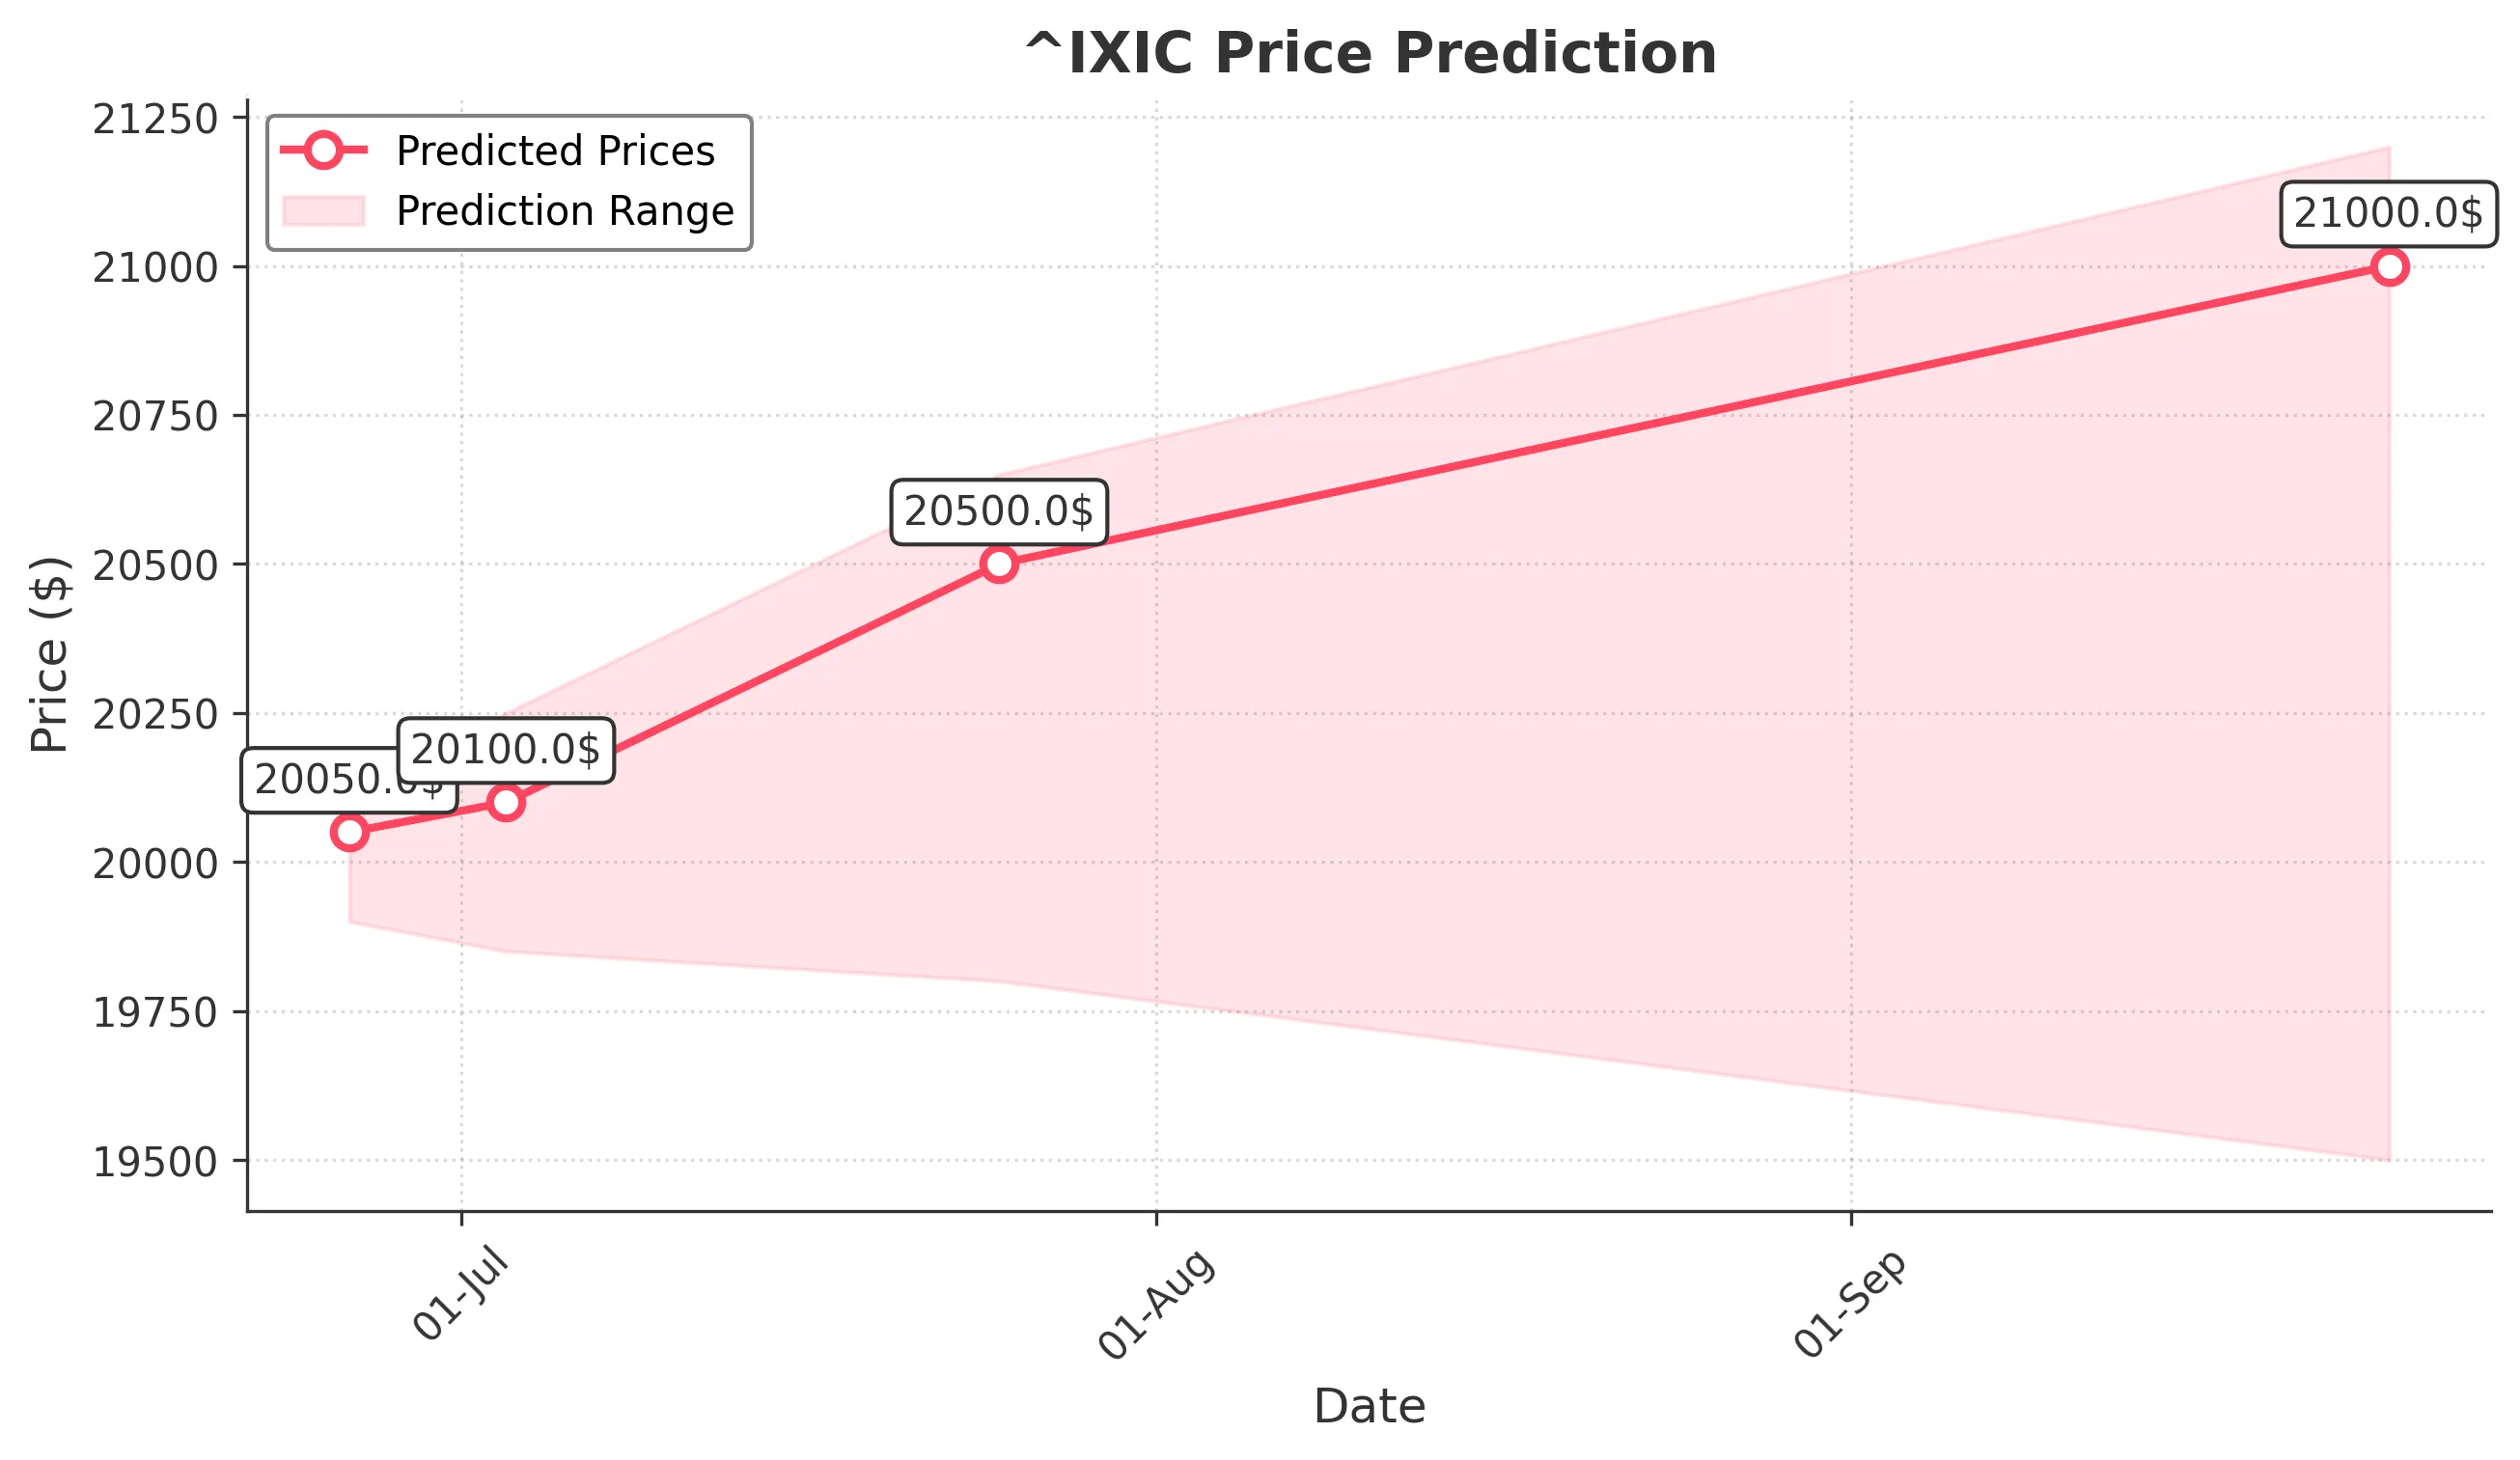
Target: June 26, 2025$20050
$20000
$20100
$19900
Description
The recent bullish trend, supported by strong volume and a breakout above resistance at 20000, suggests a continuation. RSI is neutral, indicating potential for further gains. However, watch for volatility due to macroeconomic news.
Analysis
The past 3 months show a bullish trend with significant support at 19500 and resistance at 20000. The MACD indicates upward momentum, while volume spikes on up days suggest strong buying interest. However, recent volatility raises concerns.
Confidence Level
Potential Risks
Potential market corrections or external news could impact the prediction.
1 Week Prediction
Target: July 3, 2025$20100
$20050
$20250
$19850
Description
With the current upward momentum and a bullish engulfing pattern, the outlook remains positive. The MACD is above the signal line, indicating strength. However, external factors could introduce volatility.
Analysis
The index has shown resilience, bouncing off support levels. The RSI is approaching overbought territory, suggesting caution. Volume trends indicate strong interest, but potential resistance at 20250 may limit upside.
Confidence Level
Potential Risks
Market sentiment could shift due to economic data releases or geopolitical events.
1 Month Prediction
Target: July 25, 2025$20500
$20100
$20650
$19800
Description
The bullish trend is expected to continue, supported by strong fundamentals and positive market sentiment. Fibonacci retracement levels suggest potential for further gains, but watch for signs of exhaustion.
Analysis
The index has been trending upward, with key support at 20000. The MACD remains bullish, but the RSI indicates potential overbought conditions. Volume patterns suggest strong buying, but caution is warranted as the market approaches resistance.
Confidence Level
Potential Risks
Economic indicators and earnings reports could lead to unexpected volatility.
3 Months Prediction
Target: September 25, 2025$21000
$20500
$21200
$19500
Description
Long-term bullish sentiment is supported by strong economic indicators and a favorable macro environment. However, potential corrections could occur if market sentiment shifts.
Analysis
The index has shown a strong upward trajectory, with significant support at 20000. The MACD indicates sustained momentum, but the RSI suggests caution as it approaches overbought levels. Volume trends remain strong, but external factors could introduce risk.
Confidence Level
Potential Risks
Unforeseen economic events or shifts in market sentiment could lead to volatility.