NSDQ Trading Predictions
1 Day Prediction
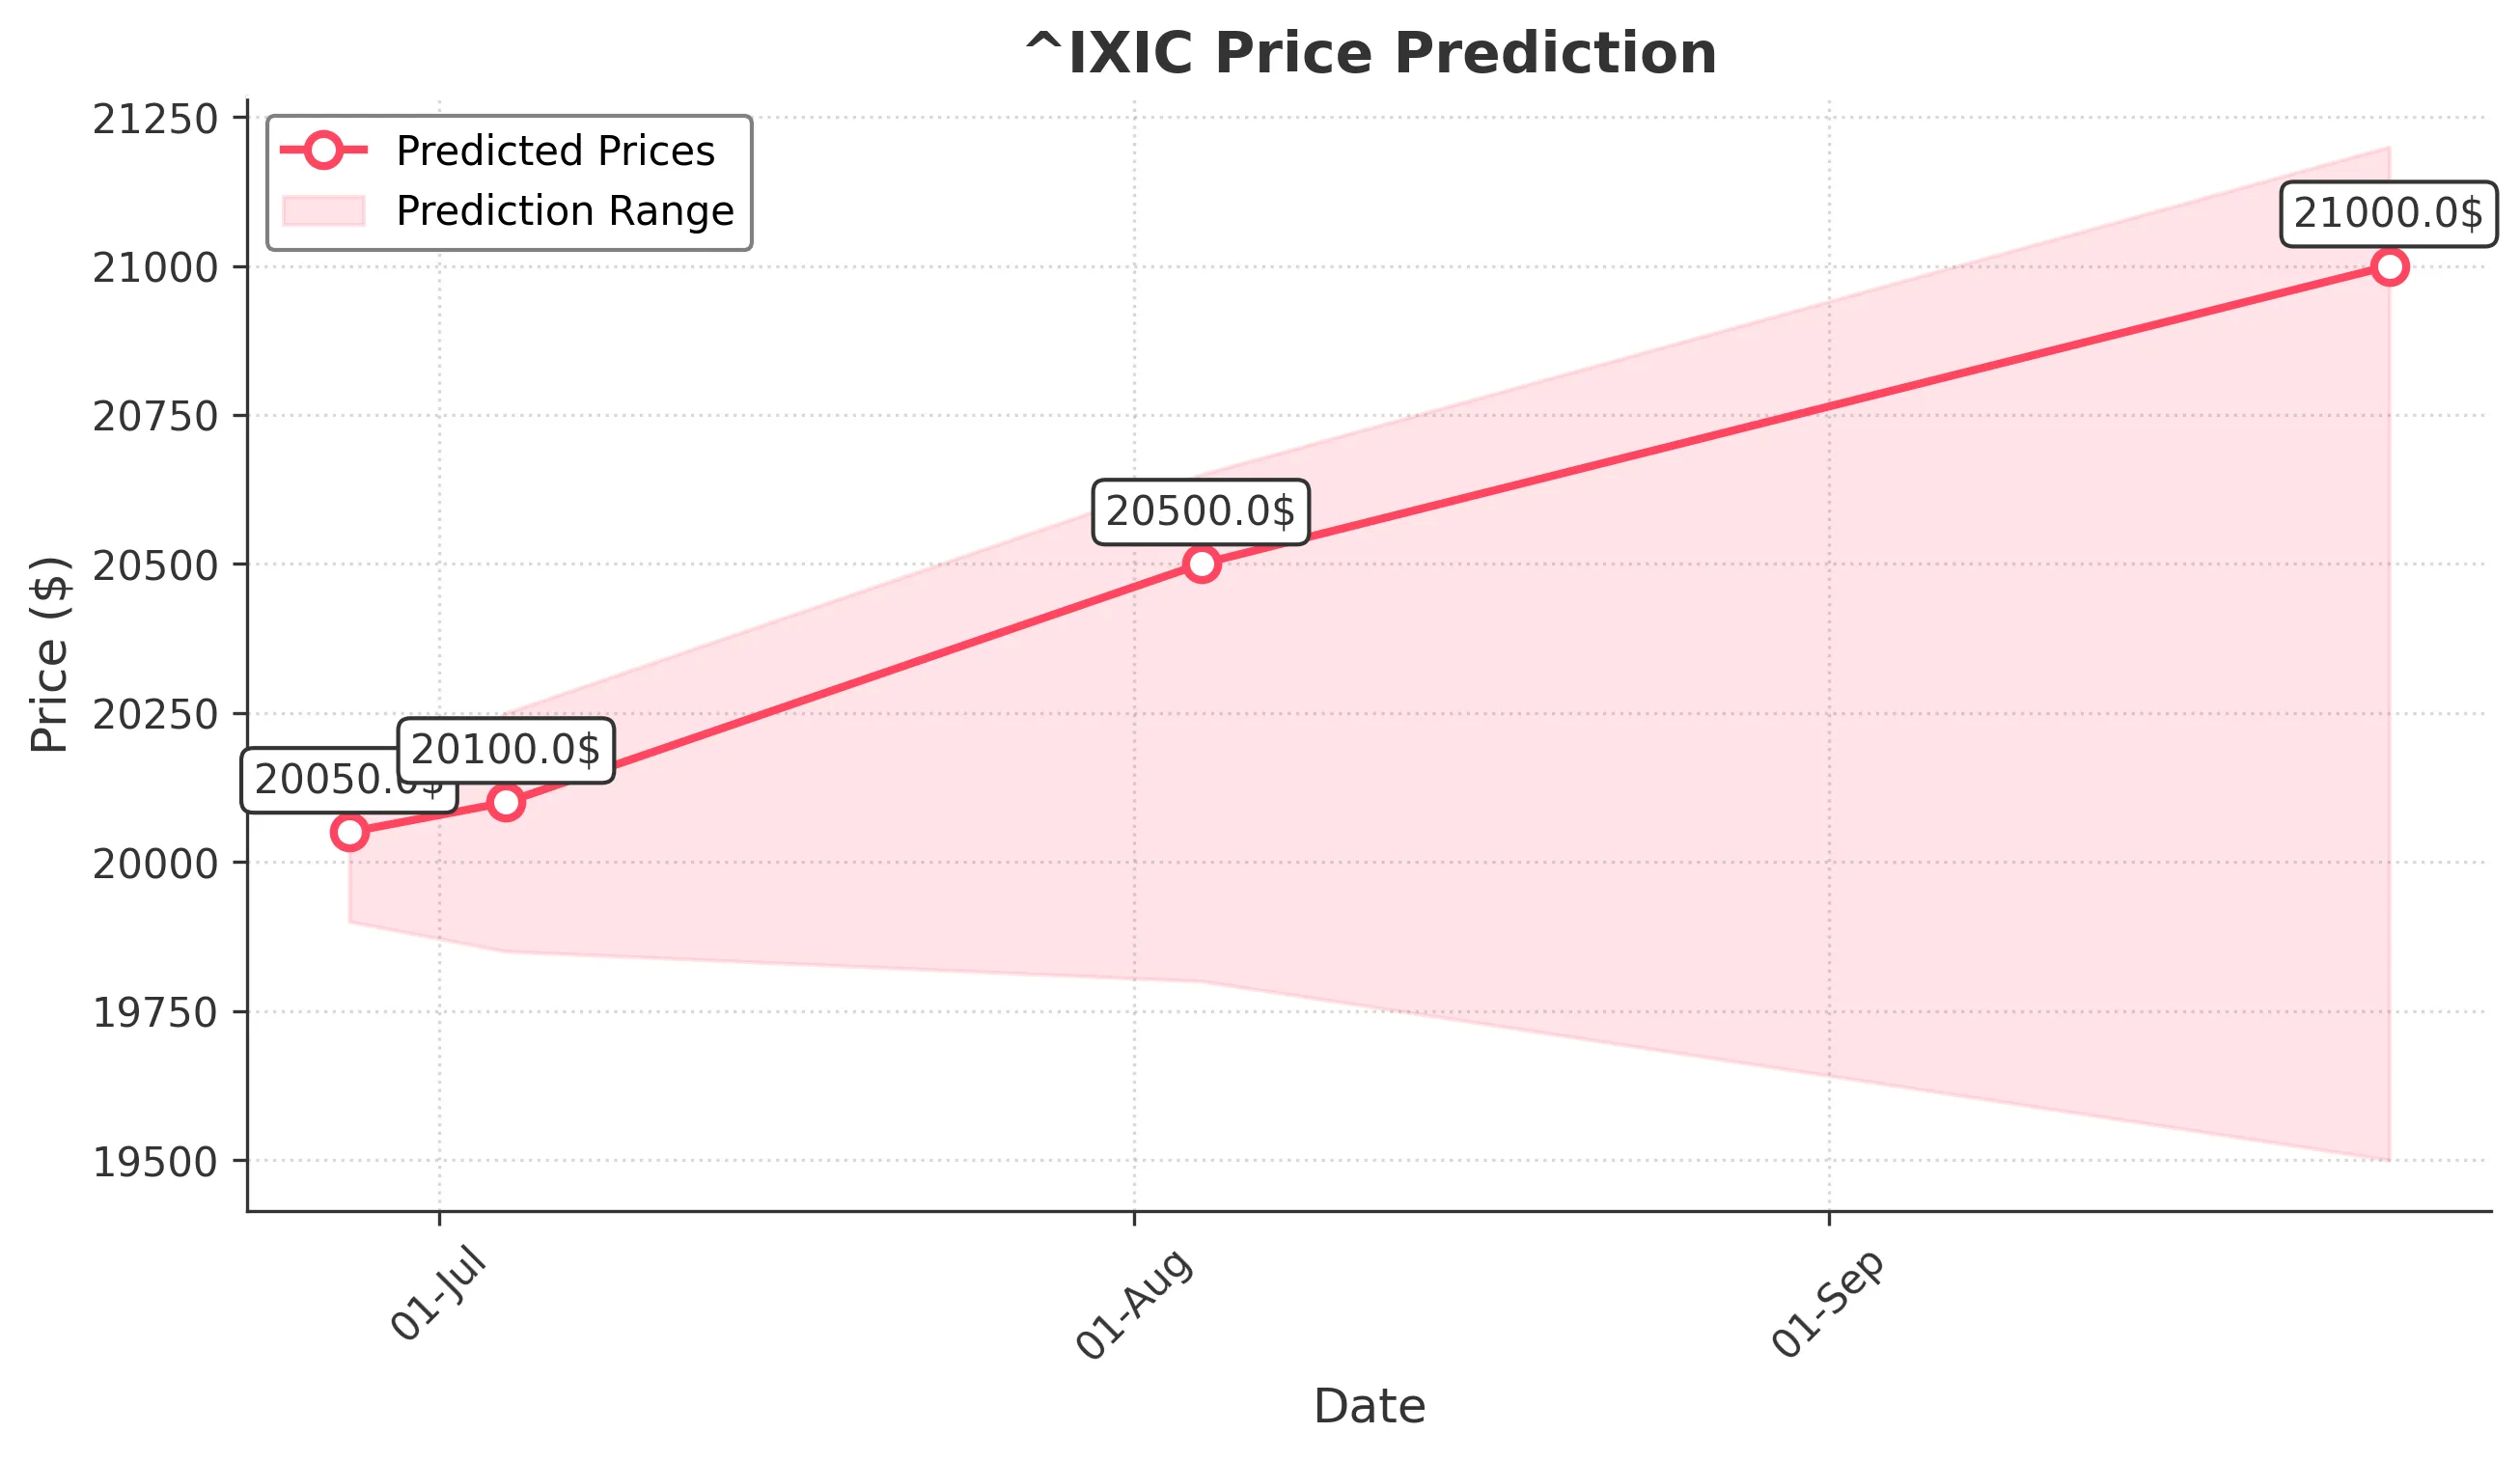
Target: June 27, 2025$20050
$20000
$20100
$19900
Description
The market shows bullish momentum with a recent upward trend. The RSI is approaching overbought levels, indicating potential for a pullback. However, strong support at 19900 and positive market sentiment suggest a close around 20050.
Analysis
The past 3 months show a bullish trend with significant support at 19900. The MACD indicates upward momentum, while the RSI is nearing overbought territory. Volume has been stable, but spikes on up days suggest strong buying interest.
Confidence Level
Potential Risks
Potential volatility due to macroeconomic news could impact the prediction.
1 Week Prediction
Target: July 4, 2025$20100
$20050
$20250
$19850
Description
With the current bullish trend and strong support levels, a close around 20100 is expected. The market sentiment remains positive, but caution is advised as the RSI indicates potential overbought conditions.
Analysis
The stock has shown consistent upward movement, with resistance at 20250. The MACD remains bullish, and volume patterns indicate strong buying. However, the RSI suggests caution as it approaches overbought levels.
Confidence Level
Potential Risks
Market corrections or external economic factors could lead to unexpected price movements.
1 Month Prediction
Target: August 4, 2025$20500
$20100
$20650
$19800
Description
The bullish trend is expected to continue, with a target close of 20500. The market sentiment is strong, but the RSI indicates potential for a pullback. Watch for support at 19800.
Analysis
The stock has been in a bullish phase, with key support at 19800. The MACD is positive, but the RSI suggests caution. Volume has been healthy, indicating strong interest, but external factors could impact future performance.
Confidence Level
Potential Risks
Economic data releases and geopolitical events could introduce volatility.
3 Months Prediction
Target: September 26, 2025$21000
$20500
$21200
$19500
Description
Looking ahead, a close around 21000 is anticipated as the bullish trend persists. However, the market may face resistance at 21200. The RSI indicates potential overbought conditions, warranting caution.
Analysis
The stock has shown a strong upward trend, with significant resistance at 21200. The MACD remains bullish, but the RSI suggests overbought conditions. Volume patterns indicate strong buying, but external factors could lead to volatility.
Confidence Level
Potential Risks
Long-term predictions are uncertain due to potential market corrections and economic shifts.