NSDQ Trading Predictions
1 Day Prediction
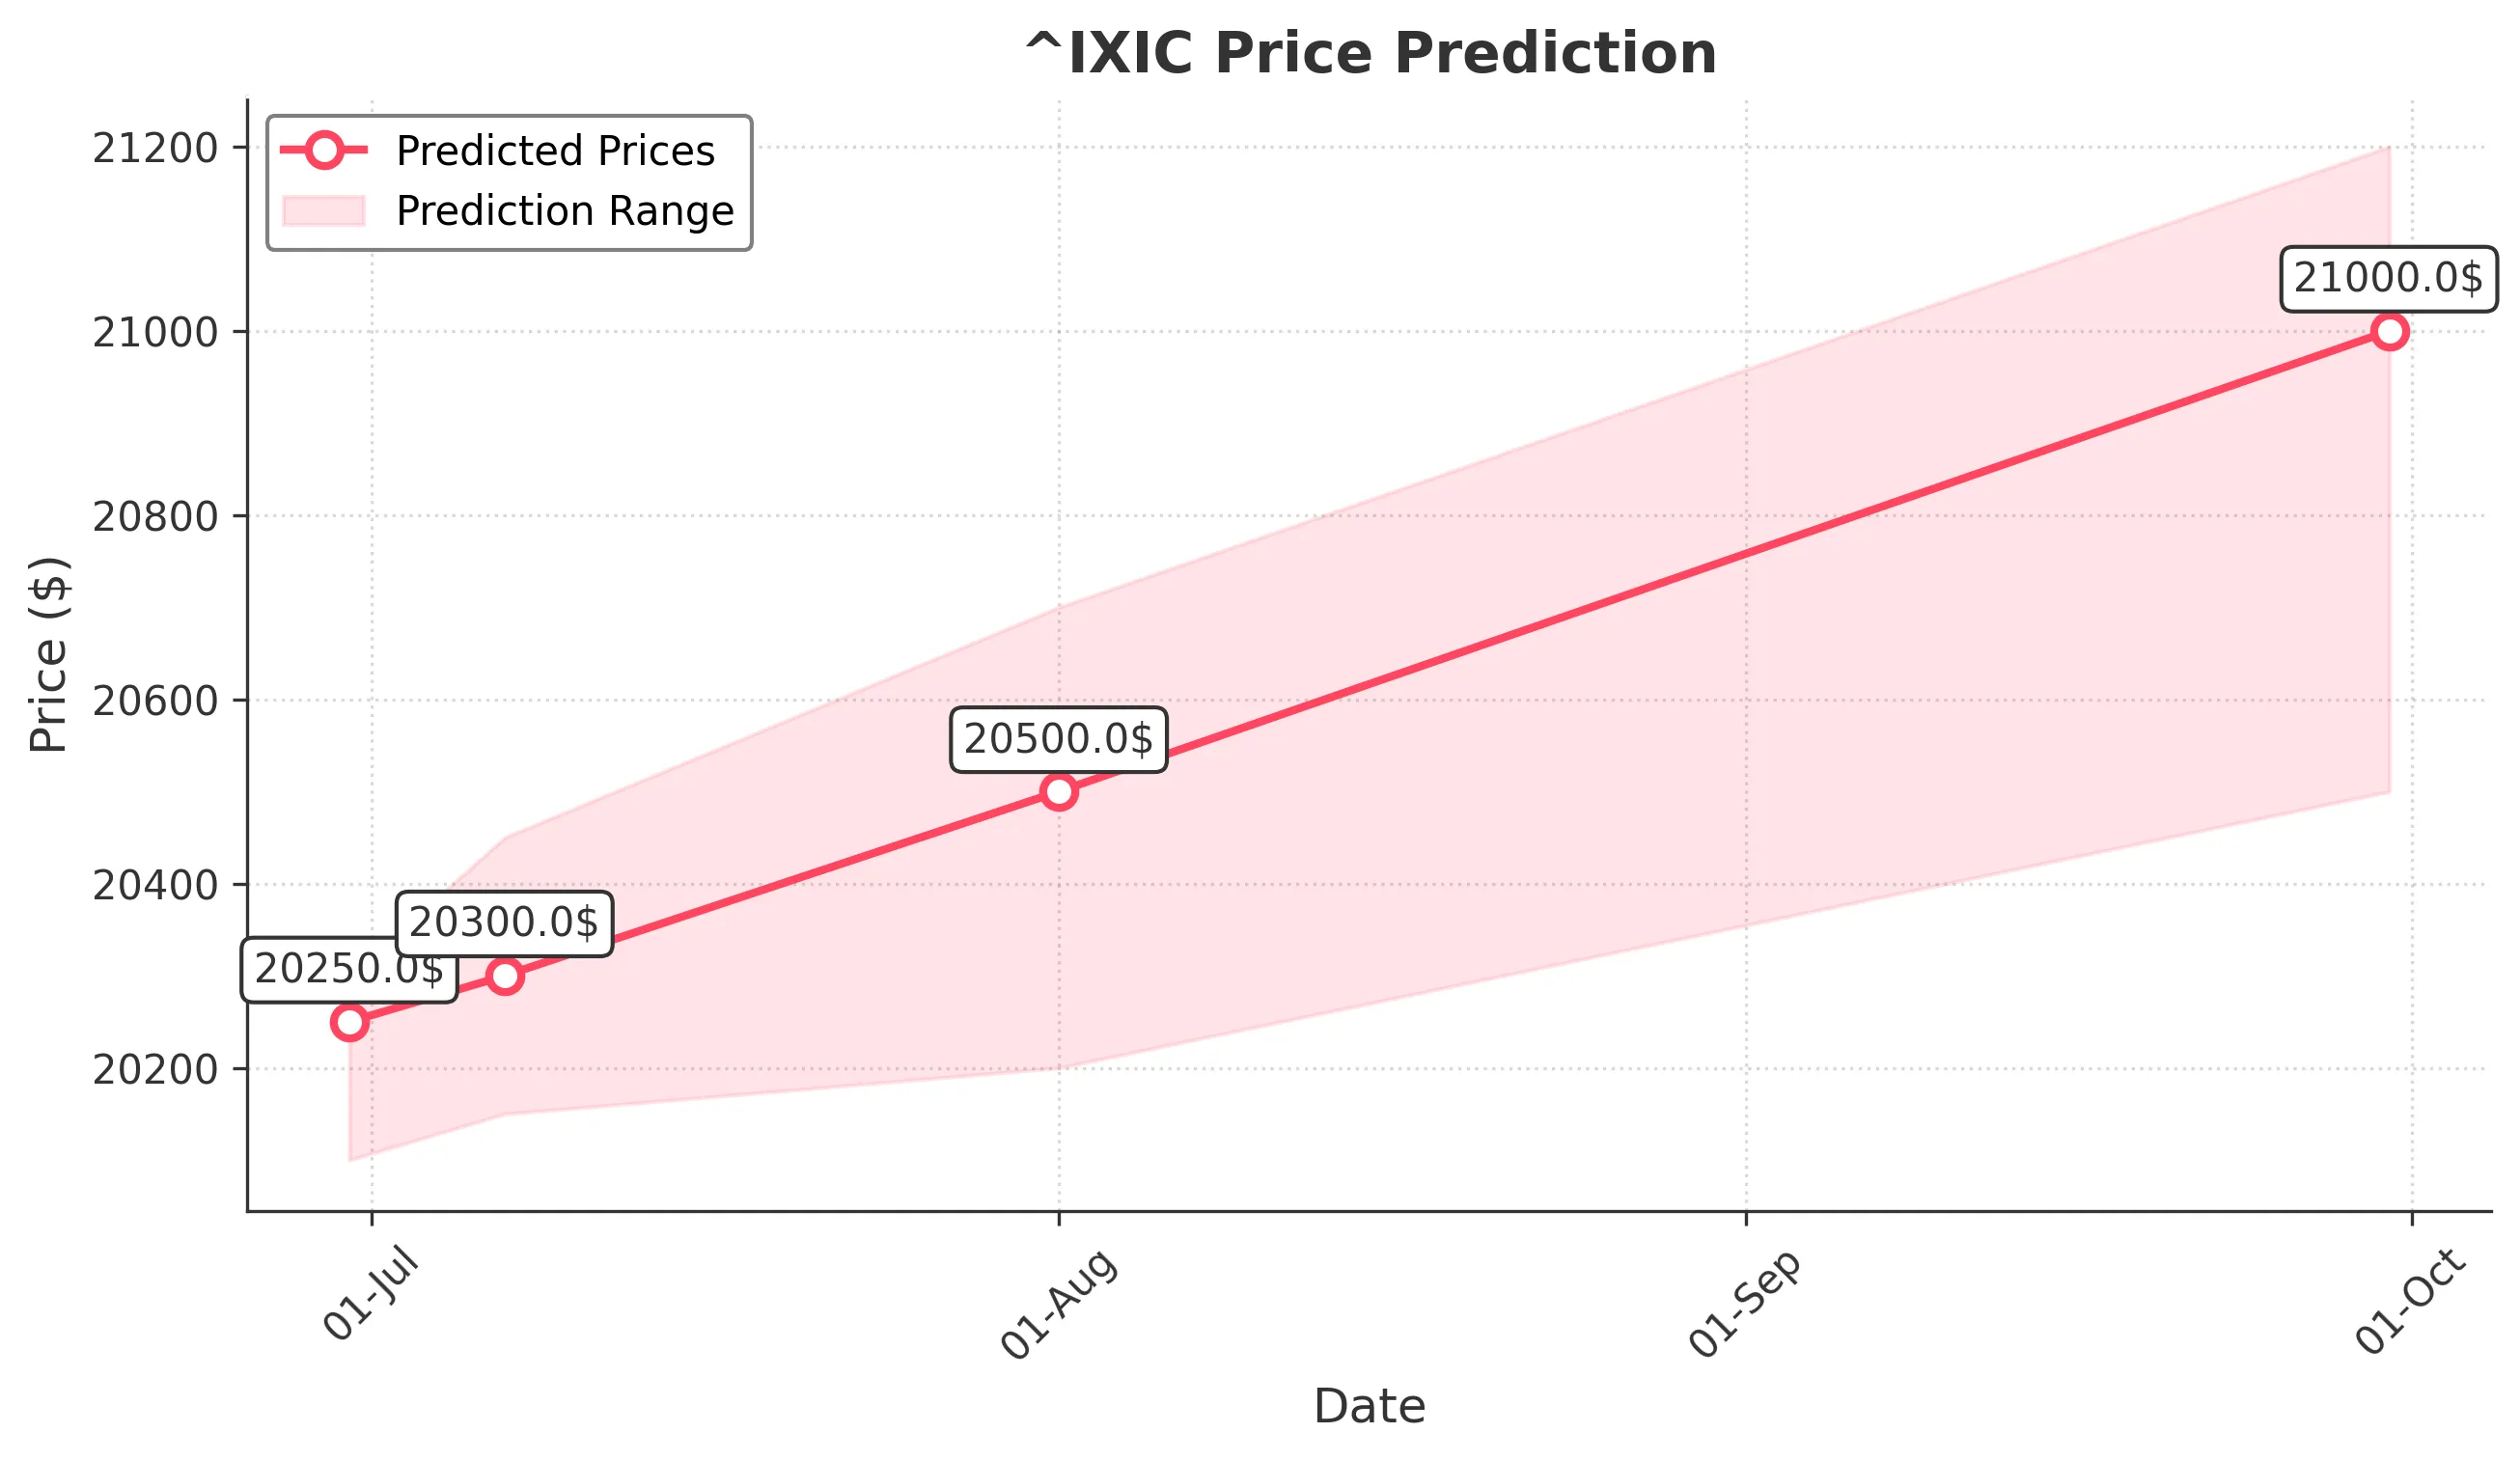
Target: June 30, 2025$20250
$20200
$20300
$20100
Description
The market shows bullish momentum with a recent upward trend. The RSI is approaching overbought levels, indicating potential for a pullback. However, strong support at 20000 suggests limited downside risk. Volume remains healthy, supporting the upward movement.
Analysis
Over the past 3 months, ^IXIC has shown a bullish trend, recovering from a significant drop. Key support at 20000 and resistance at 20500 are critical. The MACD indicates upward momentum, while the ATR suggests moderate volatility. Volume spikes on up days indicate strong buying interest.
Confidence Level
Potential Risks
Potential market volatility due to macroeconomic news could impact the prediction.
1 Week Prediction
Target: July 7, 2025$20300
$20250
$20450
$20150
Description
The bullish trend is expected to continue, supported by strong buying volume. The MACD remains positive, and the RSI is stabilizing. However, a potential resistance at 20500 may limit upside. Watch for any bearish reversal patterns.
Analysis
The index has been on an upward trajectory, with significant support at 20000. The recent candlestick patterns show bullish engulfing formations, indicating strong buying pressure. However, the market remains sensitive to macroeconomic developments.
Confidence Level
Potential Risks
Market sentiment could shift due to external economic factors, affecting the prediction.
1 Month Prediction
Target: August 1, 2025$20500
$20350
$20700
$20200
Description
The index is likely to test the 20500 resistance level, with bullish momentum supported by positive market sentiment. However, the RSI indicates overbought conditions, suggesting a possible pullback. Volume trends remain strong.
Analysis
The past three months have shown a recovery from lows, with the index approaching key resistance levels. The MACD indicates bullish momentum, but the RSI suggests caution. Volume patterns indicate strong interest, but external factors could introduce volatility.
Confidence Level
Potential Risks
A reversal could occur if economic data disappoints or if geopolitical tensions rise.
3 Months Prediction
Target: September 30, 2025$21000
$20800
$21200
$20500
Description
Long-term bullish outlook as the index is expected to break through resistance levels. Continued economic recovery and positive earnings reports could drive prices higher. However, watch for potential corrections as the market may overheat.
Analysis
The index has shown resilience, with a bullish trend supported by strong fundamentals. Key resistance at 21000 may pose challenges, and the market's reaction to economic data will be crucial. The ATR indicates increasing volatility, suggesting caution.
Confidence Level
Potential Risks
Economic indicators and potential market corrections could impact the forecast significantly.