NSDQ Trading Predictions
1 Day Prediction
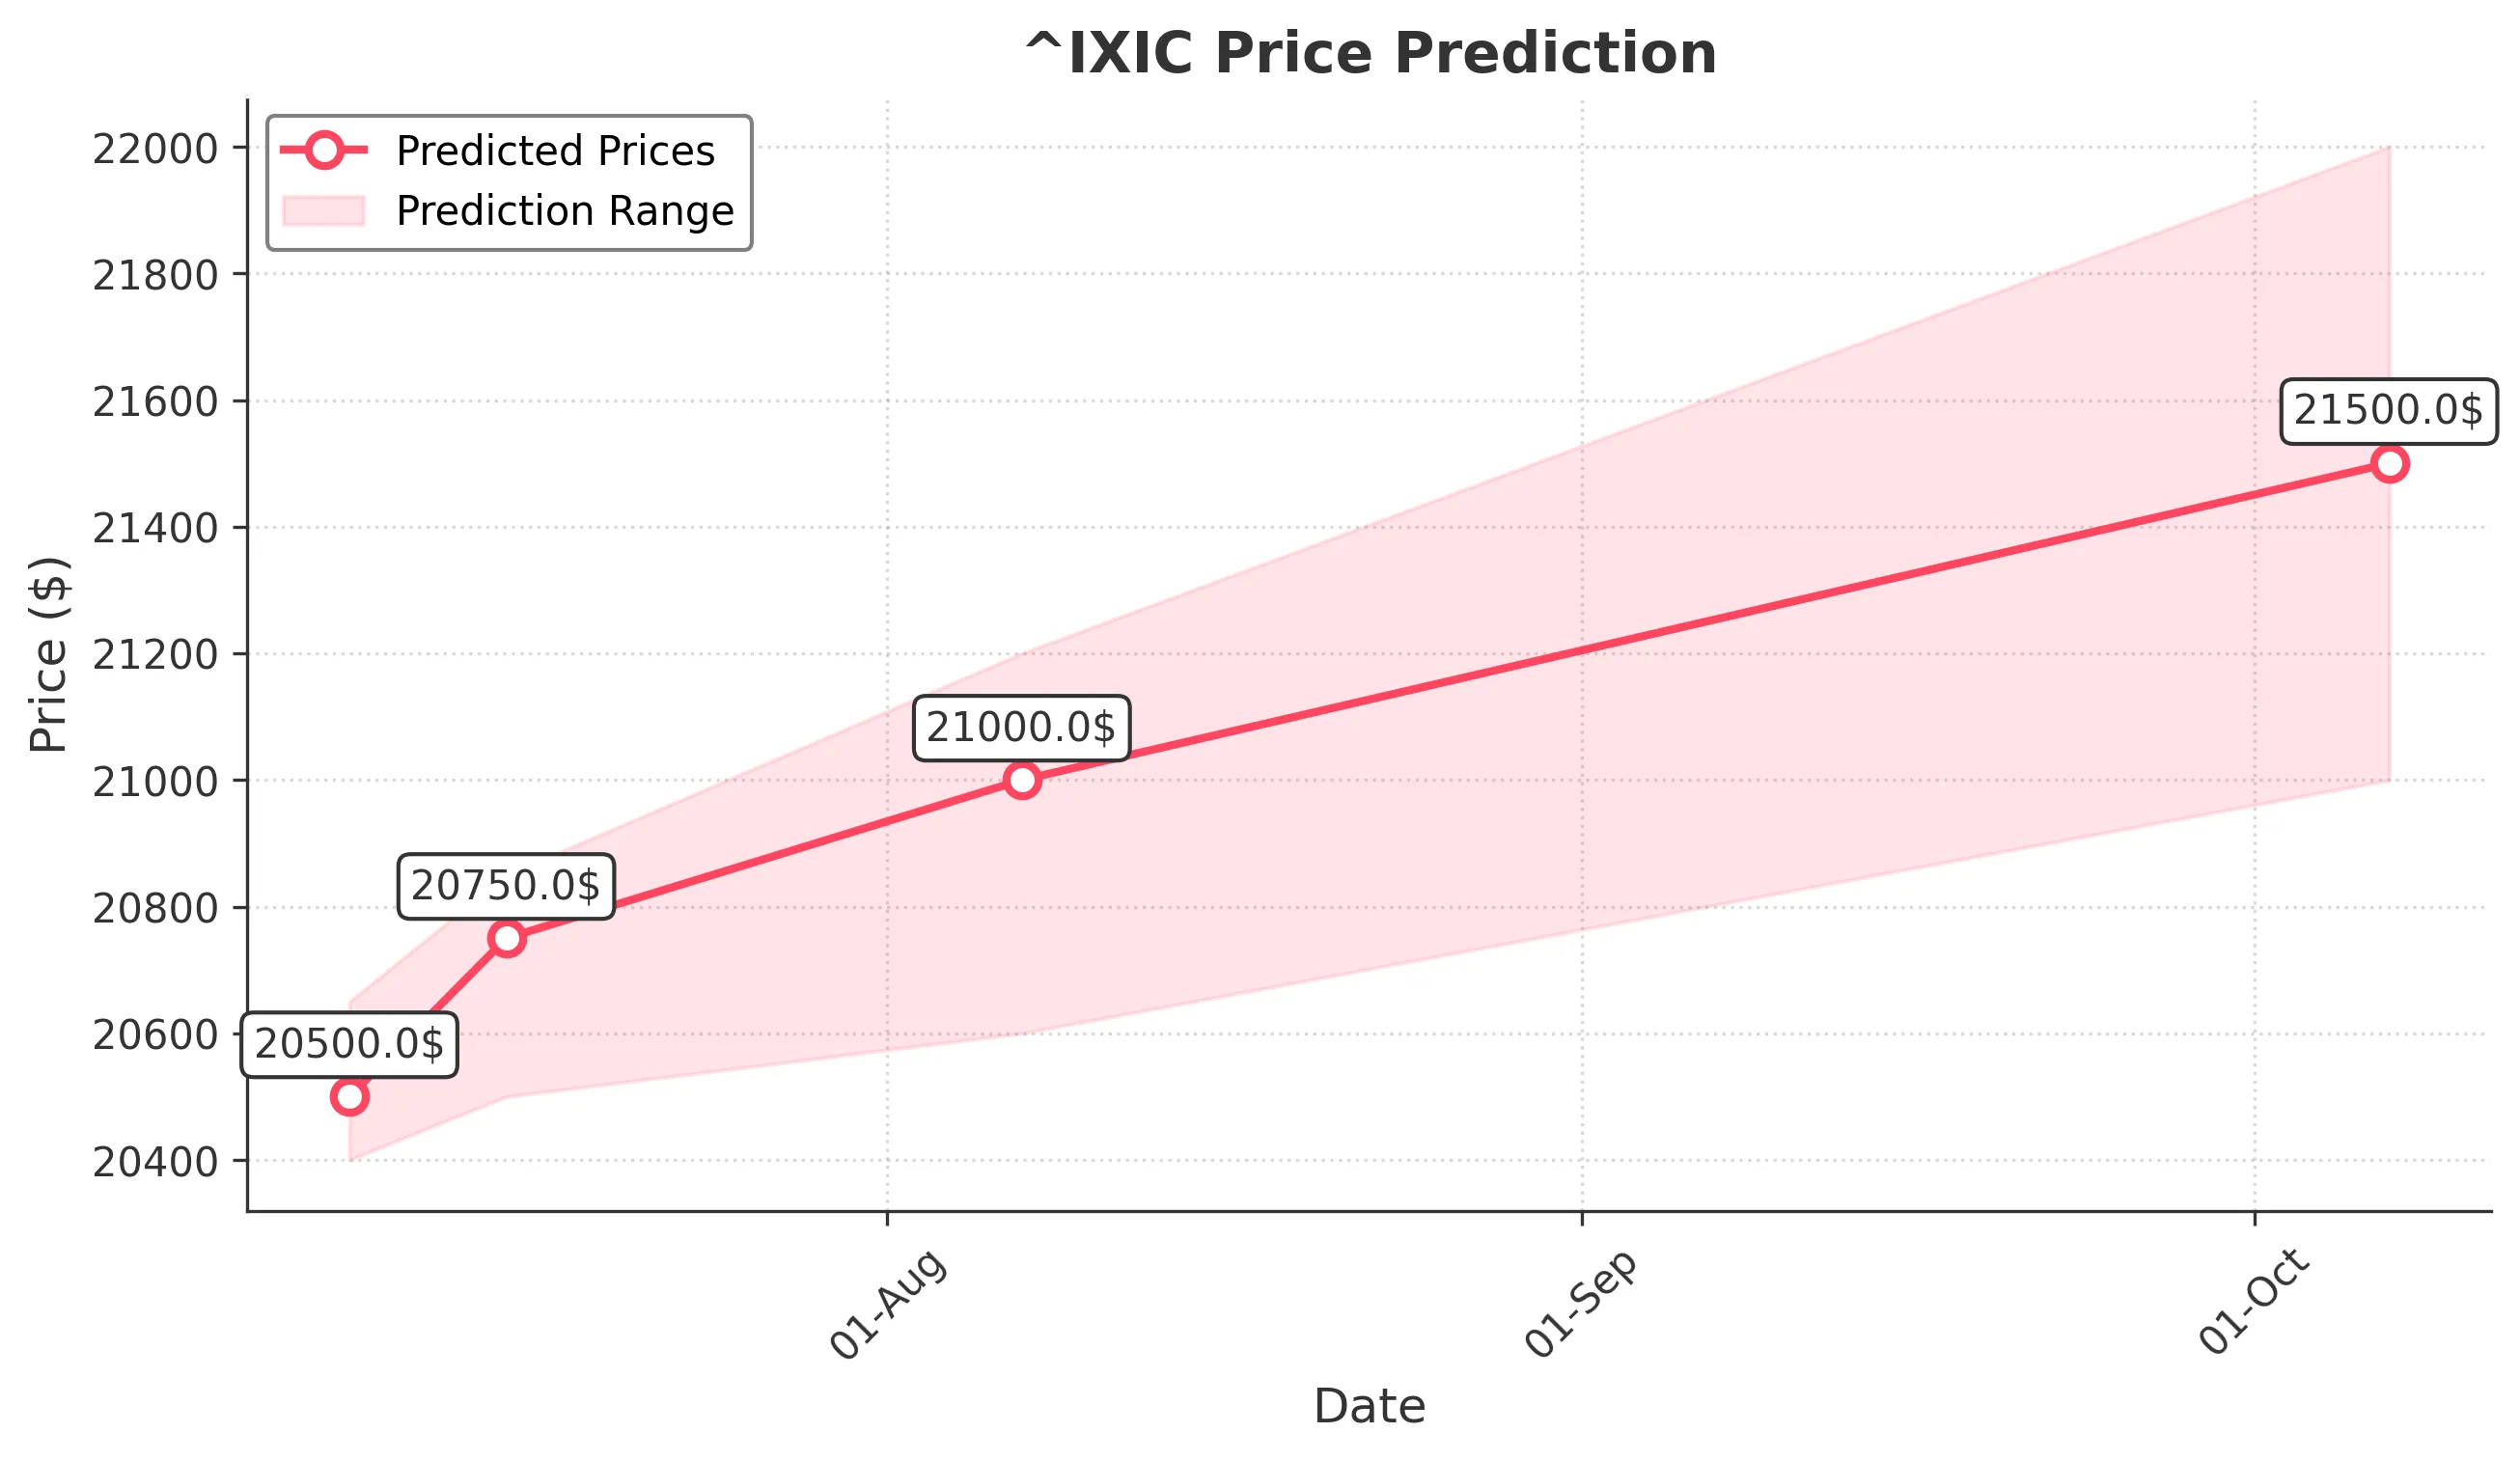
Target: July 8, 2025$20500
$20490
$20650
$20400
Description
The market shows bullish momentum with a recent upward trend. The RSI is approaching overbought levels, indicating potential for a pullback. However, strong support at 20400 suggests stability. Volume remains healthy, supporting the upward movement.
Analysis
Over the past 3 months, ^IXIC has shown a bullish trend, with significant upward movements. Key support is at 20400, while resistance is near 20650. The MACD indicates bullish momentum, but the RSI suggests caution as it nears overbought territory. Volume patterns are strong, indicating healthy trading activity.
Confidence Level
Potential Risks
Potential for a reversal exists if market sentiment shifts or if macroeconomic news impacts investor confidence.
1 Week Prediction
Target: July 15, 2025$20750
$20550
$20850
$20500
Description
The bullish trend is expected to continue, supported by strong market sentiment and positive technical indicators. The MACD remains bullish, and the price is likely to test resistance at 20850. However, watch for potential pullbacks as the RSI approaches overbought levels.
Analysis
The past 3 months have shown a clear upward trajectory for ^IXIC, with significant resistance at 20850. The MACD and moving averages indicate bullish momentum, while volume spikes suggest strong interest. However, the RSI nearing overbought levels raises caution for potential corrections.
Confidence Level
Potential Risks
Market volatility and external economic factors could lead to unexpected price movements, especially if earnings reports or geopolitical events arise.
1 Month Prediction
Target: August 7, 2025$21000
$20750
$21200
$20600
Description
Continued bullish sentiment is expected, with the price likely to reach 21000 as it breaks through resistance levels. The MACD remains positive, and volume trends support upward movement. However, caution is advised as the market may face corrections.
Analysis
The stock has shown a strong bullish trend over the last 3 months, with key resistance at 21200. The MACD and moving averages indicate continued upward momentum, but the RSI suggests potential overbought conditions. Volume patterns are robust, indicating strong investor interest.
Confidence Level
Potential Risks
Economic data releases and potential market corrections could impact the bullish trend, leading to increased volatility.
3 Months Prediction
Target: October 7, 2025$21500
$21100
$22000
$21000
Description
The bullish trend is expected to persist, with the price potentially reaching 21500 as market conditions remain favorable. However, external economic factors and market corrections could introduce volatility. Watch for key support at 21000.
Analysis
In the last 3 months, ^IXIC has demonstrated a strong upward trend, with key resistance at 22000. The MACD and moving averages indicate bullish momentum, but the RSI suggests caution as it approaches overbought levels. Volume patterns remain strong, but external factors could introduce volatility.
Confidence Level
Potential Risks
Unforeseen economic events or shifts in market sentiment could lead to significant price fluctuations, impacting the bullish outlook.