NSDQ Trading Predictions
1 Day Prediction
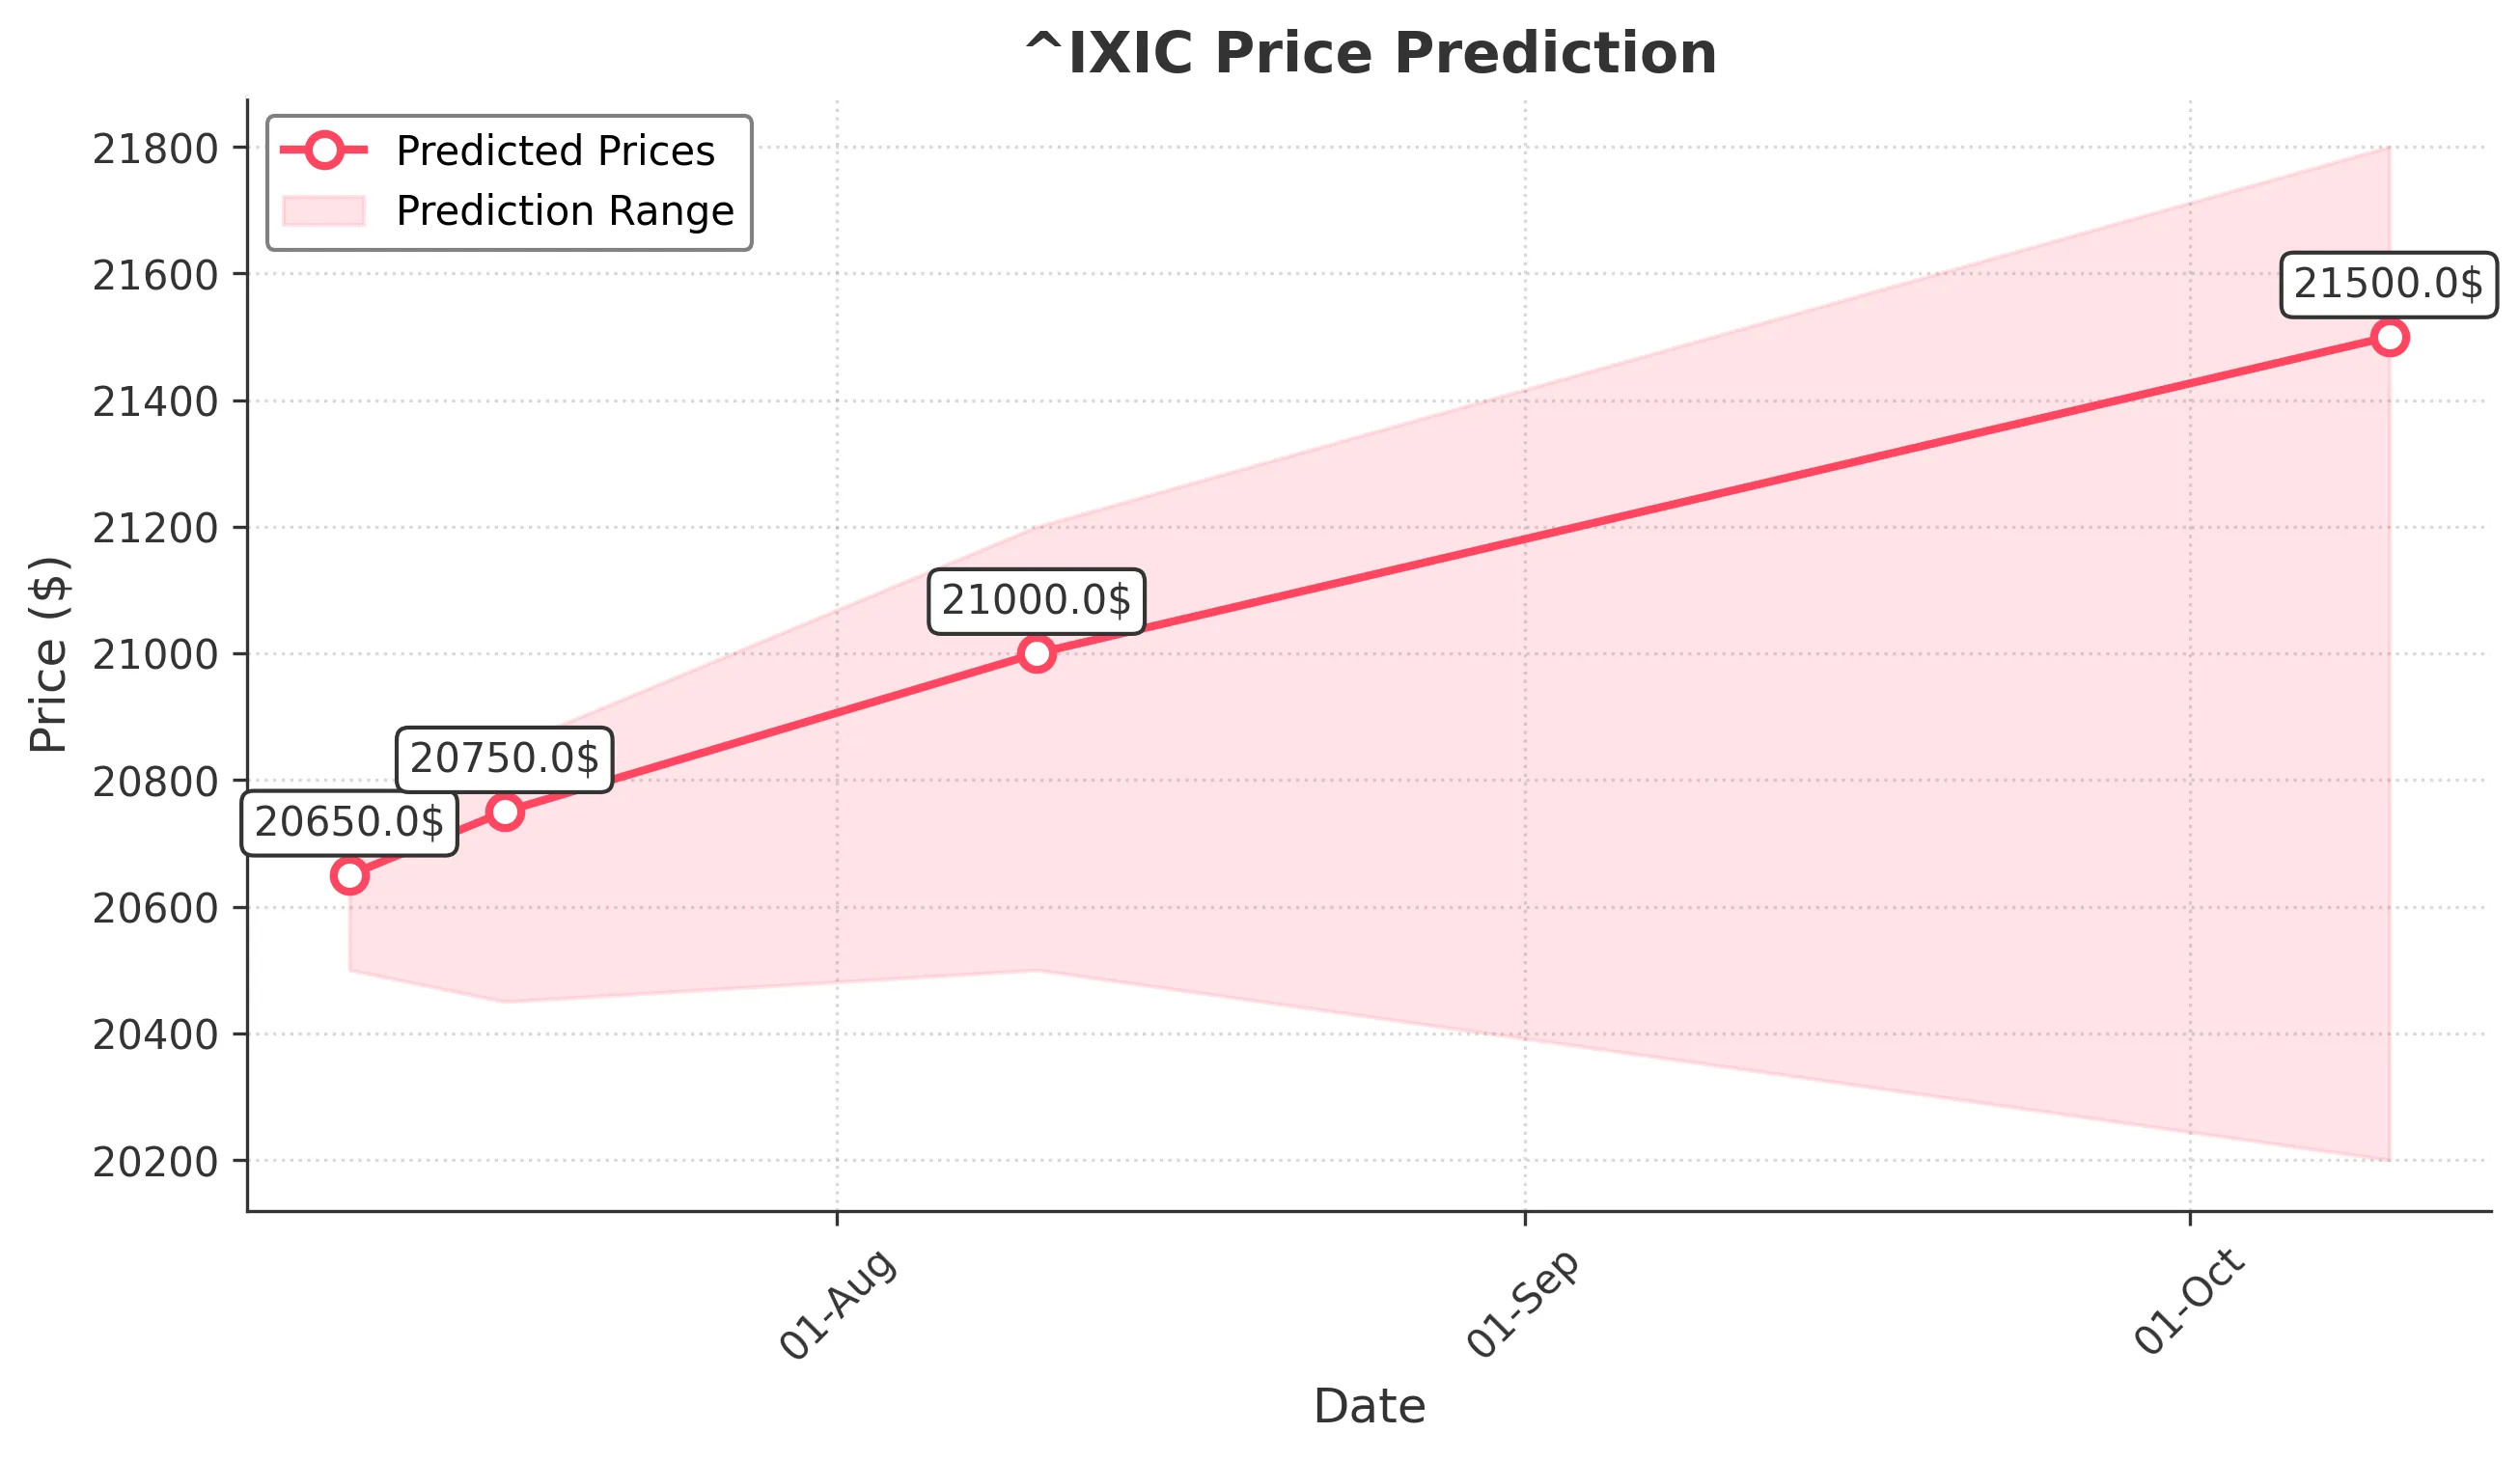
Target: July 10, 2025$20650
$20580
$20700
$20500
Description
The market shows bullish momentum with a recent upward trend. The RSI is approaching overbought levels, indicating potential for a pullback. However, strong support at 20500 suggests a likely close above this level.
Analysis
The past 3 months show a bullish trend with significant upward movement. Key support at 20500 and resistance at 20700. Volume has been consistent, indicating strong interest. Technical indicators like MACD and moving averages support continued upward momentum.
Confidence Level
Potential Risks
Potential for a reversal exists if market sentiment shifts or if external news impacts trading.
1 Week Prediction
Target: July 17, 2025$20750
$20600
$20850
$20450
Description
The bullish trend is expected to continue, supported by strong buying volume. However, the RSI indicates overbought conditions, suggesting a possible pullback. The market may test the 20800 resistance level.
Analysis
The stock has shown a strong upward trend with key support at 20500. The MACD indicates bullish momentum, but the RSI suggests caution. Volume patterns indicate strong interest, but potential resistance at 20800 may limit gains.
Confidence Level
Potential Risks
Market volatility and external economic factors could lead to unexpected price movements.
1 Month Prediction
Target: August 10, 2025$21000
$20750
$21200
$20500
Description
Continued bullish sentiment is expected, with the market likely to break through the 21000 resistance. The MACD remains positive, and volume trends support upward movement, although overbought conditions may lead to corrections.
Analysis
The stock has maintained a bullish trend with significant upward movement. Key resistance at 21000 and support at 20500. Technical indicators suggest continued strength, but caution is warranted due to potential overbought conditions.
Confidence Level
Potential Risks
Economic data releases and geopolitical events could impact market sentiment and lead to volatility.
3 Months Prediction
Target: October 10, 2025$21500
$21000
$21800
$20200
Description
The market is expected to maintain a bullish trend, with potential for new highs. However, the RSI indicates a risk of overextension. A correction could occur if economic indicators disappoint.
Analysis
The stock has shown a strong bullish trend, but potential resistance at 21500 may limit gains. Key support at 20200. Technical indicators suggest strength, but caution is advised due to potential market corrections and external influences.
Confidence Level
Potential Risks
Unforeseen economic events or shifts in market sentiment could lead to significant volatility and impact predictions.