NSDQ Trading Predictions
1 Day Prediction
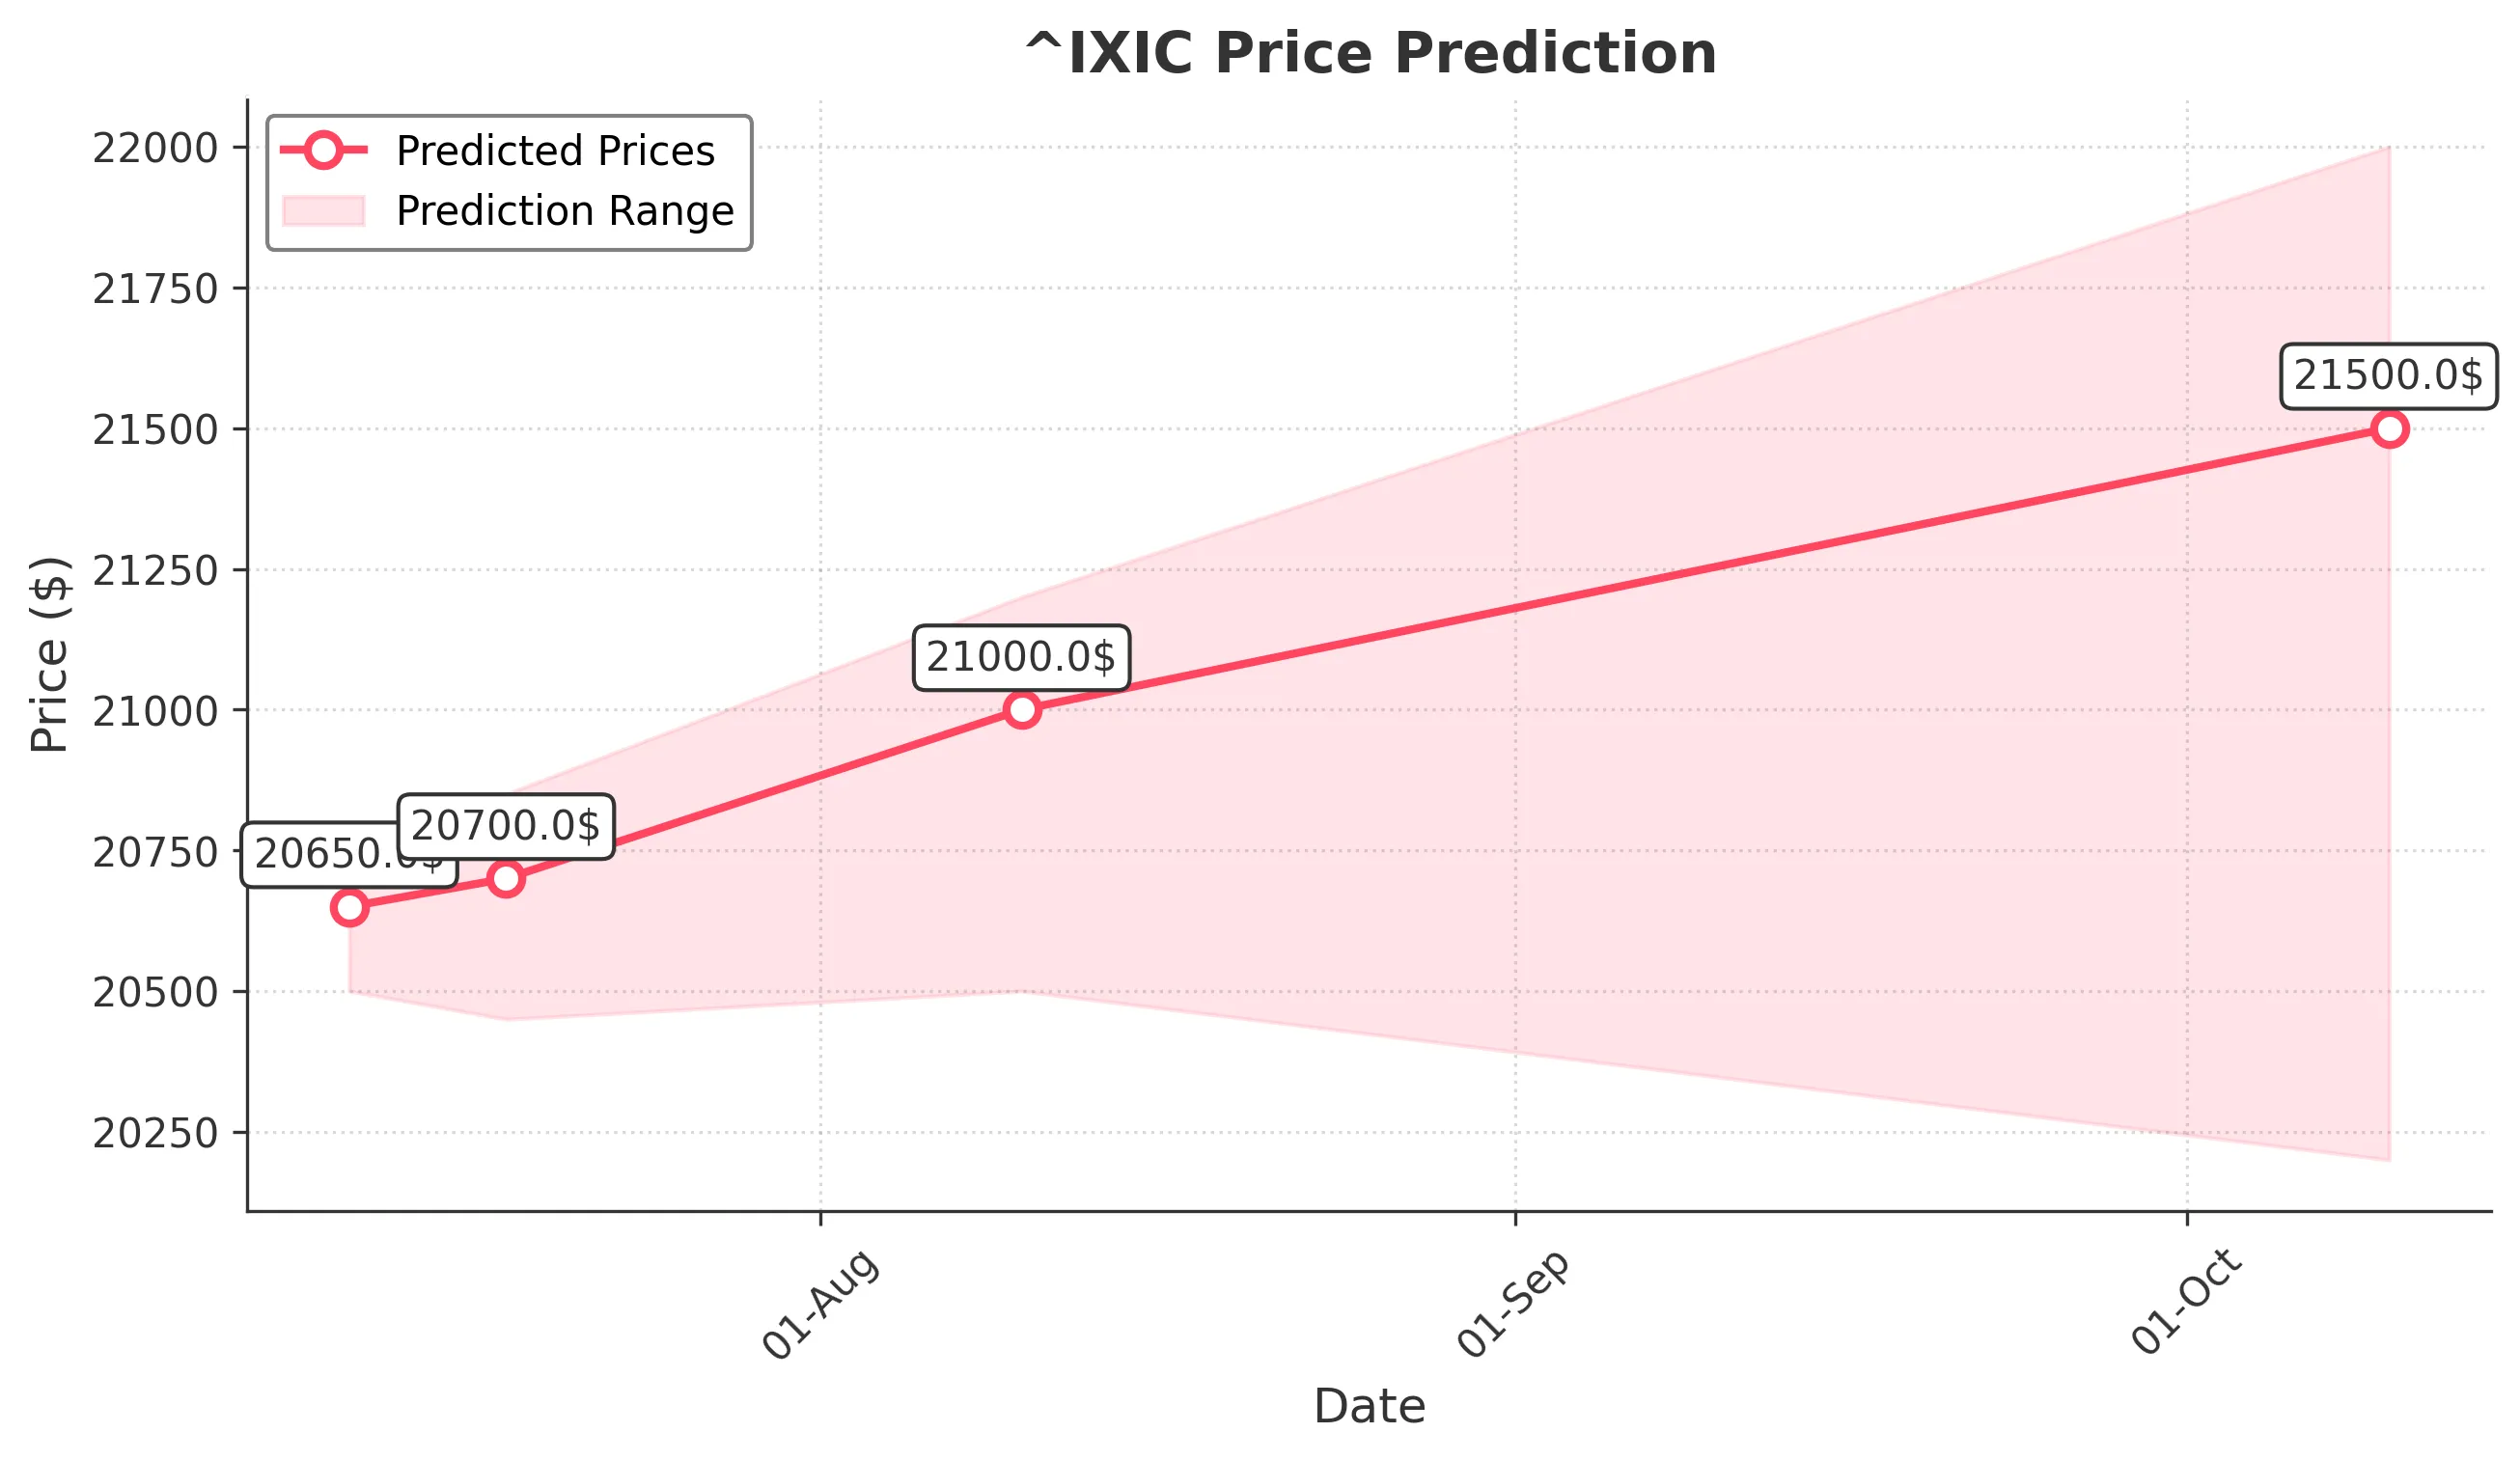
Target: July 11, 2025$20650
$20600
$20700
$20500
Description
The market shows bullish momentum with a recent upward trend. The MACD is positive, and RSI indicates strength. A Doji pattern suggests indecision, but overall sentiment remains optimistic. Volume is expected to be moderate.
Analysis
The past 3 months show a bullish trend with significant support at 20,000. The recent highs indicate strong buying interest. Technical indicators like moving averages confirm upward momentum, but volatility remains a concern.
Confidence Level
Potential Risks
Potential profit-taking could lead to volatility. A sudden market shift or negative news could impact the prediction.
1 Week Prediction
Target: July 18, 2025$20700
$20650
$20850
$20450
Description
The bullish trend is expected to continue, supported by strong technical indicators. The MACD remains positive, and RSI is not overbought. However, a potential resistance level at 20800 may limit upside movement.
Analysis
The stock has shown consistent upward movement, with key support at 20,000. The recent price action indicates strong buying pressure, but the market's volatility could lead to short-term fluctuations.
Confidence Level
Potential Risks
Market corrections or external economic factors could lead to unexpected price movements. Watch for any bearish signals.
1 Month Prediction
Target: August 10, 2025$21000
$20750
$21200
$20500
Description
The overall bullish sentiment is expected to persist, with technical indicators supporting further gains. The Fibonacci retracement levels suggest potential resistance at 21200, but the trend remains strong.
Analysis
The stock has been on a bullish trajectory, with significant support at 20,000. The indicators suggest continued strength, but external factors could impact the market's direction.
Confidence Level
Potential Risks
Economic data releases or geopolitical events could introduce volatility. A reversal pattern could emerge if the market sentiment shifts.
3 Months Prediction
Target: October 10, 2025$21500
$21000
$22000
$20200
Description
Long-term bullish outlook supported by strong fundamentals and technical indicators. However, potential resistance at 22000 may pose challenges. Market sentiment remains positive, but caution is advised.
Analysis
The stock has shown resilience with a strong upward trend. Key support levels are established, but the potential for volatility exists. External economic factors and market sentiment will play crucial roles in future performance.
Confidence Level
Potential Risks
Market corrections, economic downturns, or unexpected news could lead to significant price adjustments. Watch for bearish patterns.