NSDQ Trading Predictions
1 Day Prediction
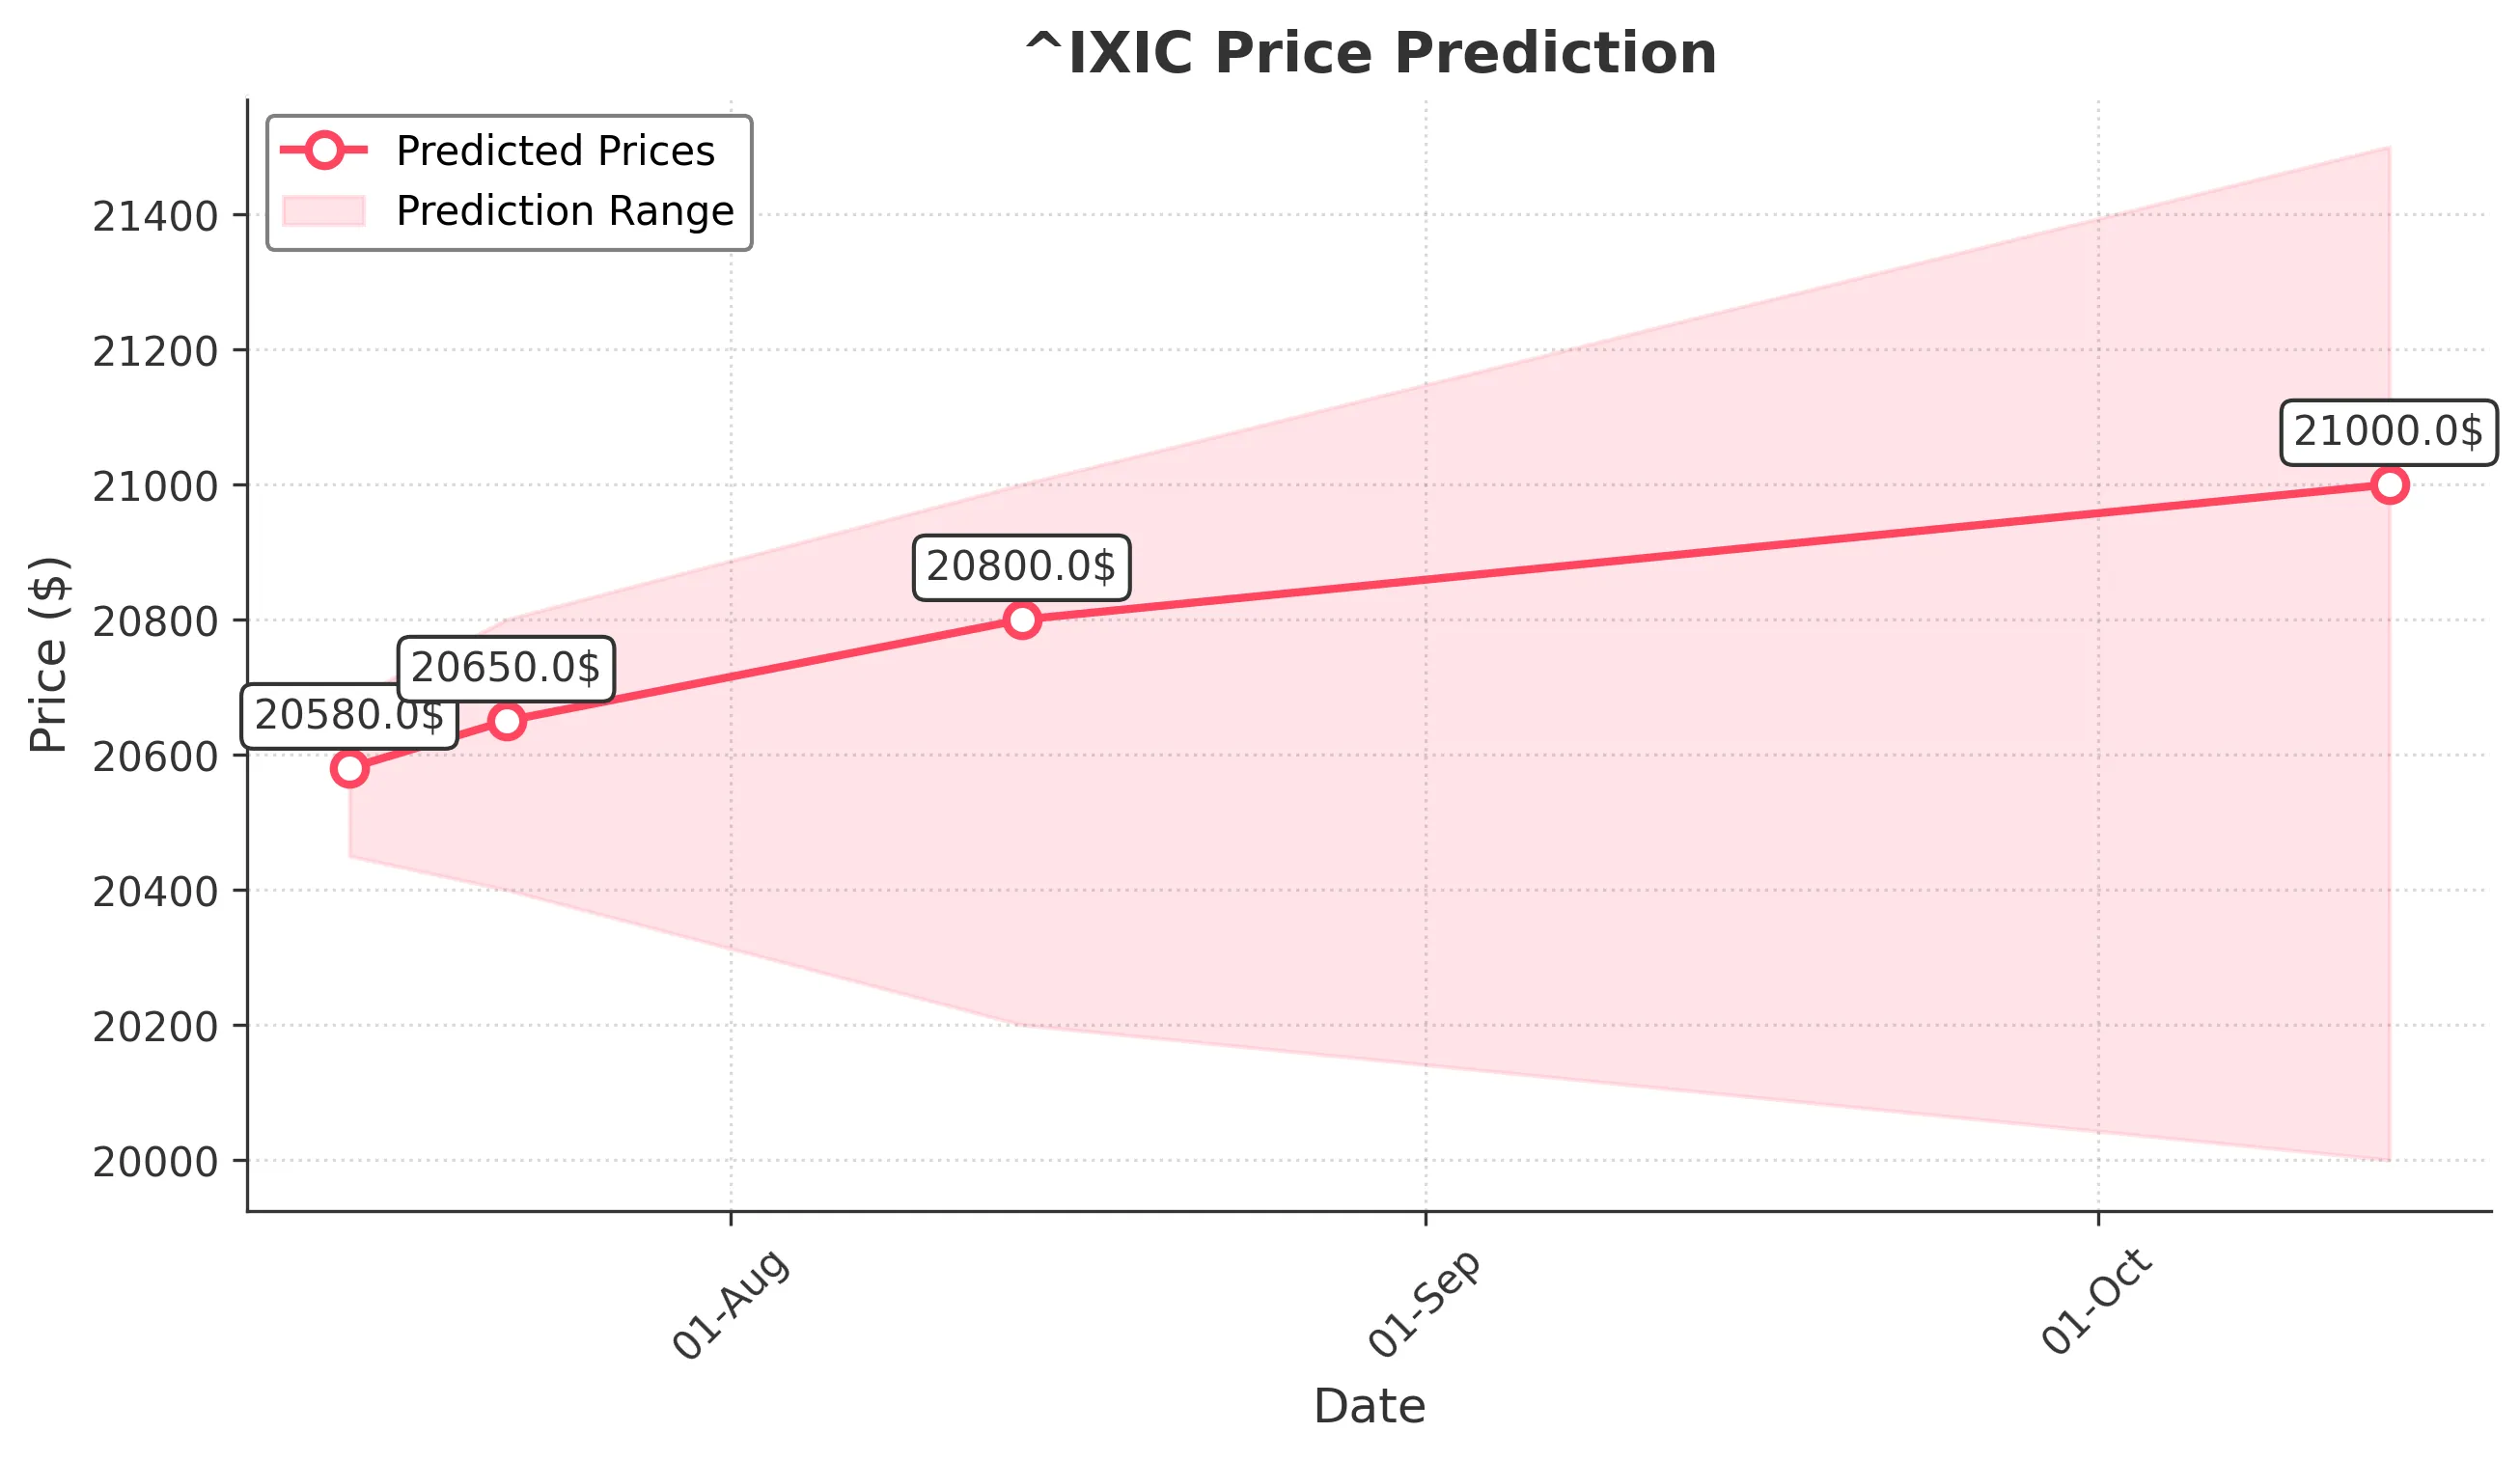
Target: July 15, 2025$20580
$20570
$20680
$20450
Description
The market shows a slight bullish trend with a recent Doji candlestick indicating indecision. The RSI is around 55, suggesting room for upward movement. However, MACD is flattening, indicating potential resistance ahead.
Analysis
The past 3 months show a bullish trend with significant upward movement. Key support at 20400 and resistance at 20700. Volume has been consistent, with spikes during major price movements. The market sentiment remains cautiously optimistic.
Confidence Level
Potential Risks
Potential market volatility due to external economic news could impact the prediction.
1 Week Prediction
Target: July 22, 2025$20650
$20590
$20800
$20400
Description
The bullish momentum is expected to continue, supported by a recent breakout above resistance levels. However, the MACD shows signs of divergence, which could indicate a potential pullback.
Analysis
The index has shown strong performance with a clear upward trend. Key resistance at 20800 and support at 20400. The RSI is nearing overbought territory, suggesting caution. Volume patterns indicate strong buying interest.
Confidence Level
Potential Risks
Market sentiment could shift due to geopolitical events or economic data releases, affecting the prediction.
1 Month Prediction
Target: August 14, 2025$20800
$20650
$21000
$20200
Description
The index is likely to maintain its upward trajectory, supported by strong earnings reports and positive economic indicators. However, the RSI indicates potential overbought conditions, which could lead to a correction.
Analysis
The overall trend remains bullish with significant upward movement. Key support at 20200 and resistance at 21000. Volume has been robust, indicating strong investor interest. The market sentiment is positive, but caution is advised.
Confidence Level
Potential Risks
Unexpected economic data or earnings misses could lead to volatility and impact the forecast.
3 Months Prediction
Target: October 14, 2025$21000
$20750
$21500
$20000
Description
Long-term bullish sentiment is expected to prevail, driven by economic recovery and strong corporate earnings. However, potential market corrections could occur if inflation data surprises negatively.
Analysis
The index has shown a strong bullish trend over the past months. Key support at 20000 and resistance at 21500. The market sentiment is generally positive, but external economic factors could introduce volatility.
Confidence Level
Potential Risks
Macroeconomic factors such as interest rate changes or inflation could significantly impact market performance.