NSDQ Trading Predictions
1 Day Prediction
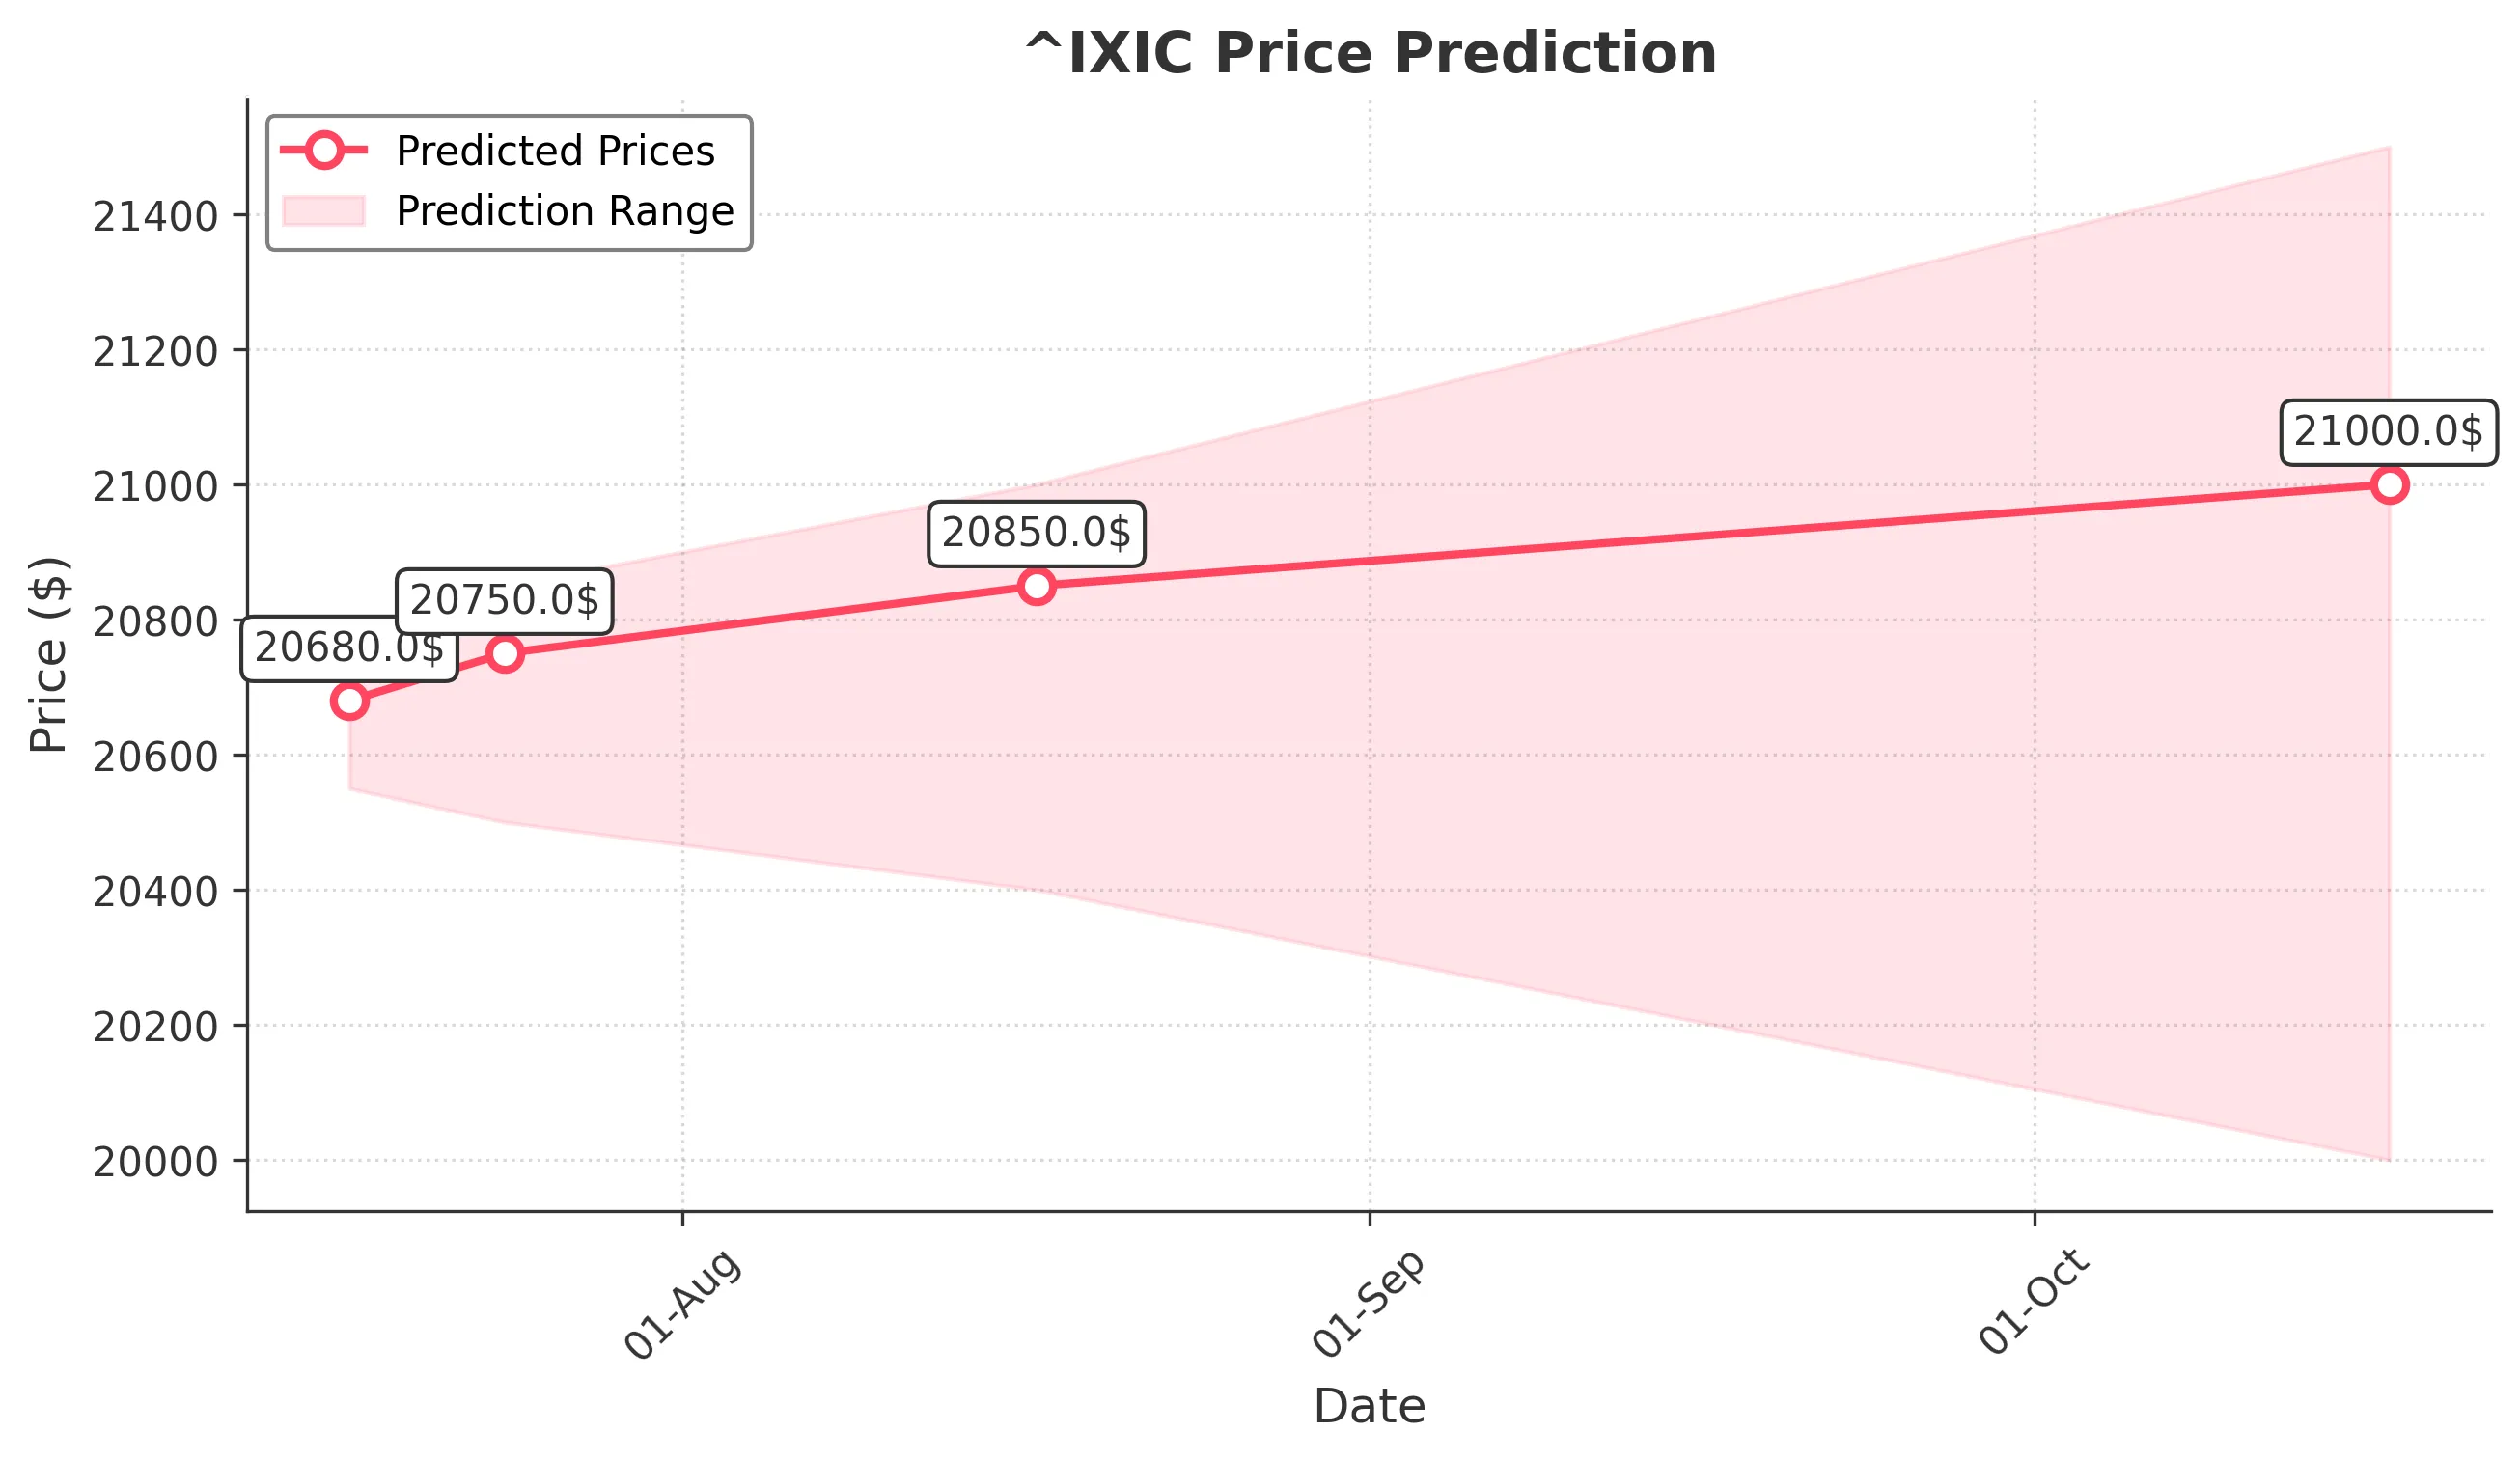
Target: July 17, 2025$20680
$20650
$20750
$20550
Description
The market shows bullish momentum with a recent upward trend. The RSI is approaching overbought levels, indicating potential for a pullback. However, strong support at 20500 suggests limited downside risk. Volume remains robust, supporting the upward movement.
Analysis
Over the past 3 months, ^IXIC has shown a bullish trend, with significant support at 20500 and resistance around 20800. The MACD indicates upward momentum, while the ATR suggests moderate volatility. Recent volume spikes indicate strong buying interest, but caution is warranted as RSI nears overbought territory.
Confidence Level
Potential Risks
Potential for a reversal exists if market sentiment shifts or if macroeconomic news impacts investor confidence.
1 Week Prediction
Target: July 24, 2025$20750
$20680
$20850
$20500
Description
The bullish trend is expected to continue, supported by strong buying volume. However, the RSI indicates potential overbought conditions, which could lead to a short-term pullback. Key resistance at 20800 may limit upside potential.
Analysis
The index has maintained a bullish trajectory, with key support at 20500. The MACD remains positive, indicating continued upward momentum. Volume patterns suggest strong investor interest, but caution is advised as the market approaches resistance levels.
Confidence Level
Potential Risks
Market volatility and external economic factors could impact the prediction, especially if earnings reports or geopolitical events arise.
1 Month Prediction
Target: August 17, 2025$20850
$20700
$21000
$20400
Description
The index is likely to test higher levels as bullish sentiment persists. However, the RSI indicates potential overbought conditions, suggesting a possible correction. Key support at 20500 remains critical for maintaining upward momentum.
Analysis
The past three months have shown a strong bullish trend, with significant resistance at 21000. The MACD and moving averages support continued upward movement, but the RSI indicates caution as it approaches overbought territory. Volume trends remain positive, but external factors could influence market direction.
Confidence Level
Potential Risks
Economic data releases and earnings reports could introduce volatility, potentially impacting the index's performance.
3 Months Prediction
Target: October 17, 2025$21000
$20800
$21500
$20000
Description
Long-term bullish sentiment is expected to drive prices higher, with potential for a test of 21500. However, market corrections may occur, especially if economic indicators disappoint. Key support at 20000 is crucial for sustaining the upward trend.
Analysis
The index has shown a strong upward trend over the last three months, with key support at 20000 and resistance at 21500. The MACD indicates bullish momentum, but the RSI suggests caution as it approaches overbought levels. Volume patterns indicate strong interest, but external economic factors could introduce uncertainty.
Confidence Level
Potential Risks
Unforeseen economic events or shifts in market sentiment could lead to significant volatility, impacting the accuracy of this prediction.