NSDQ Trading Predictions
1 Day Prediction
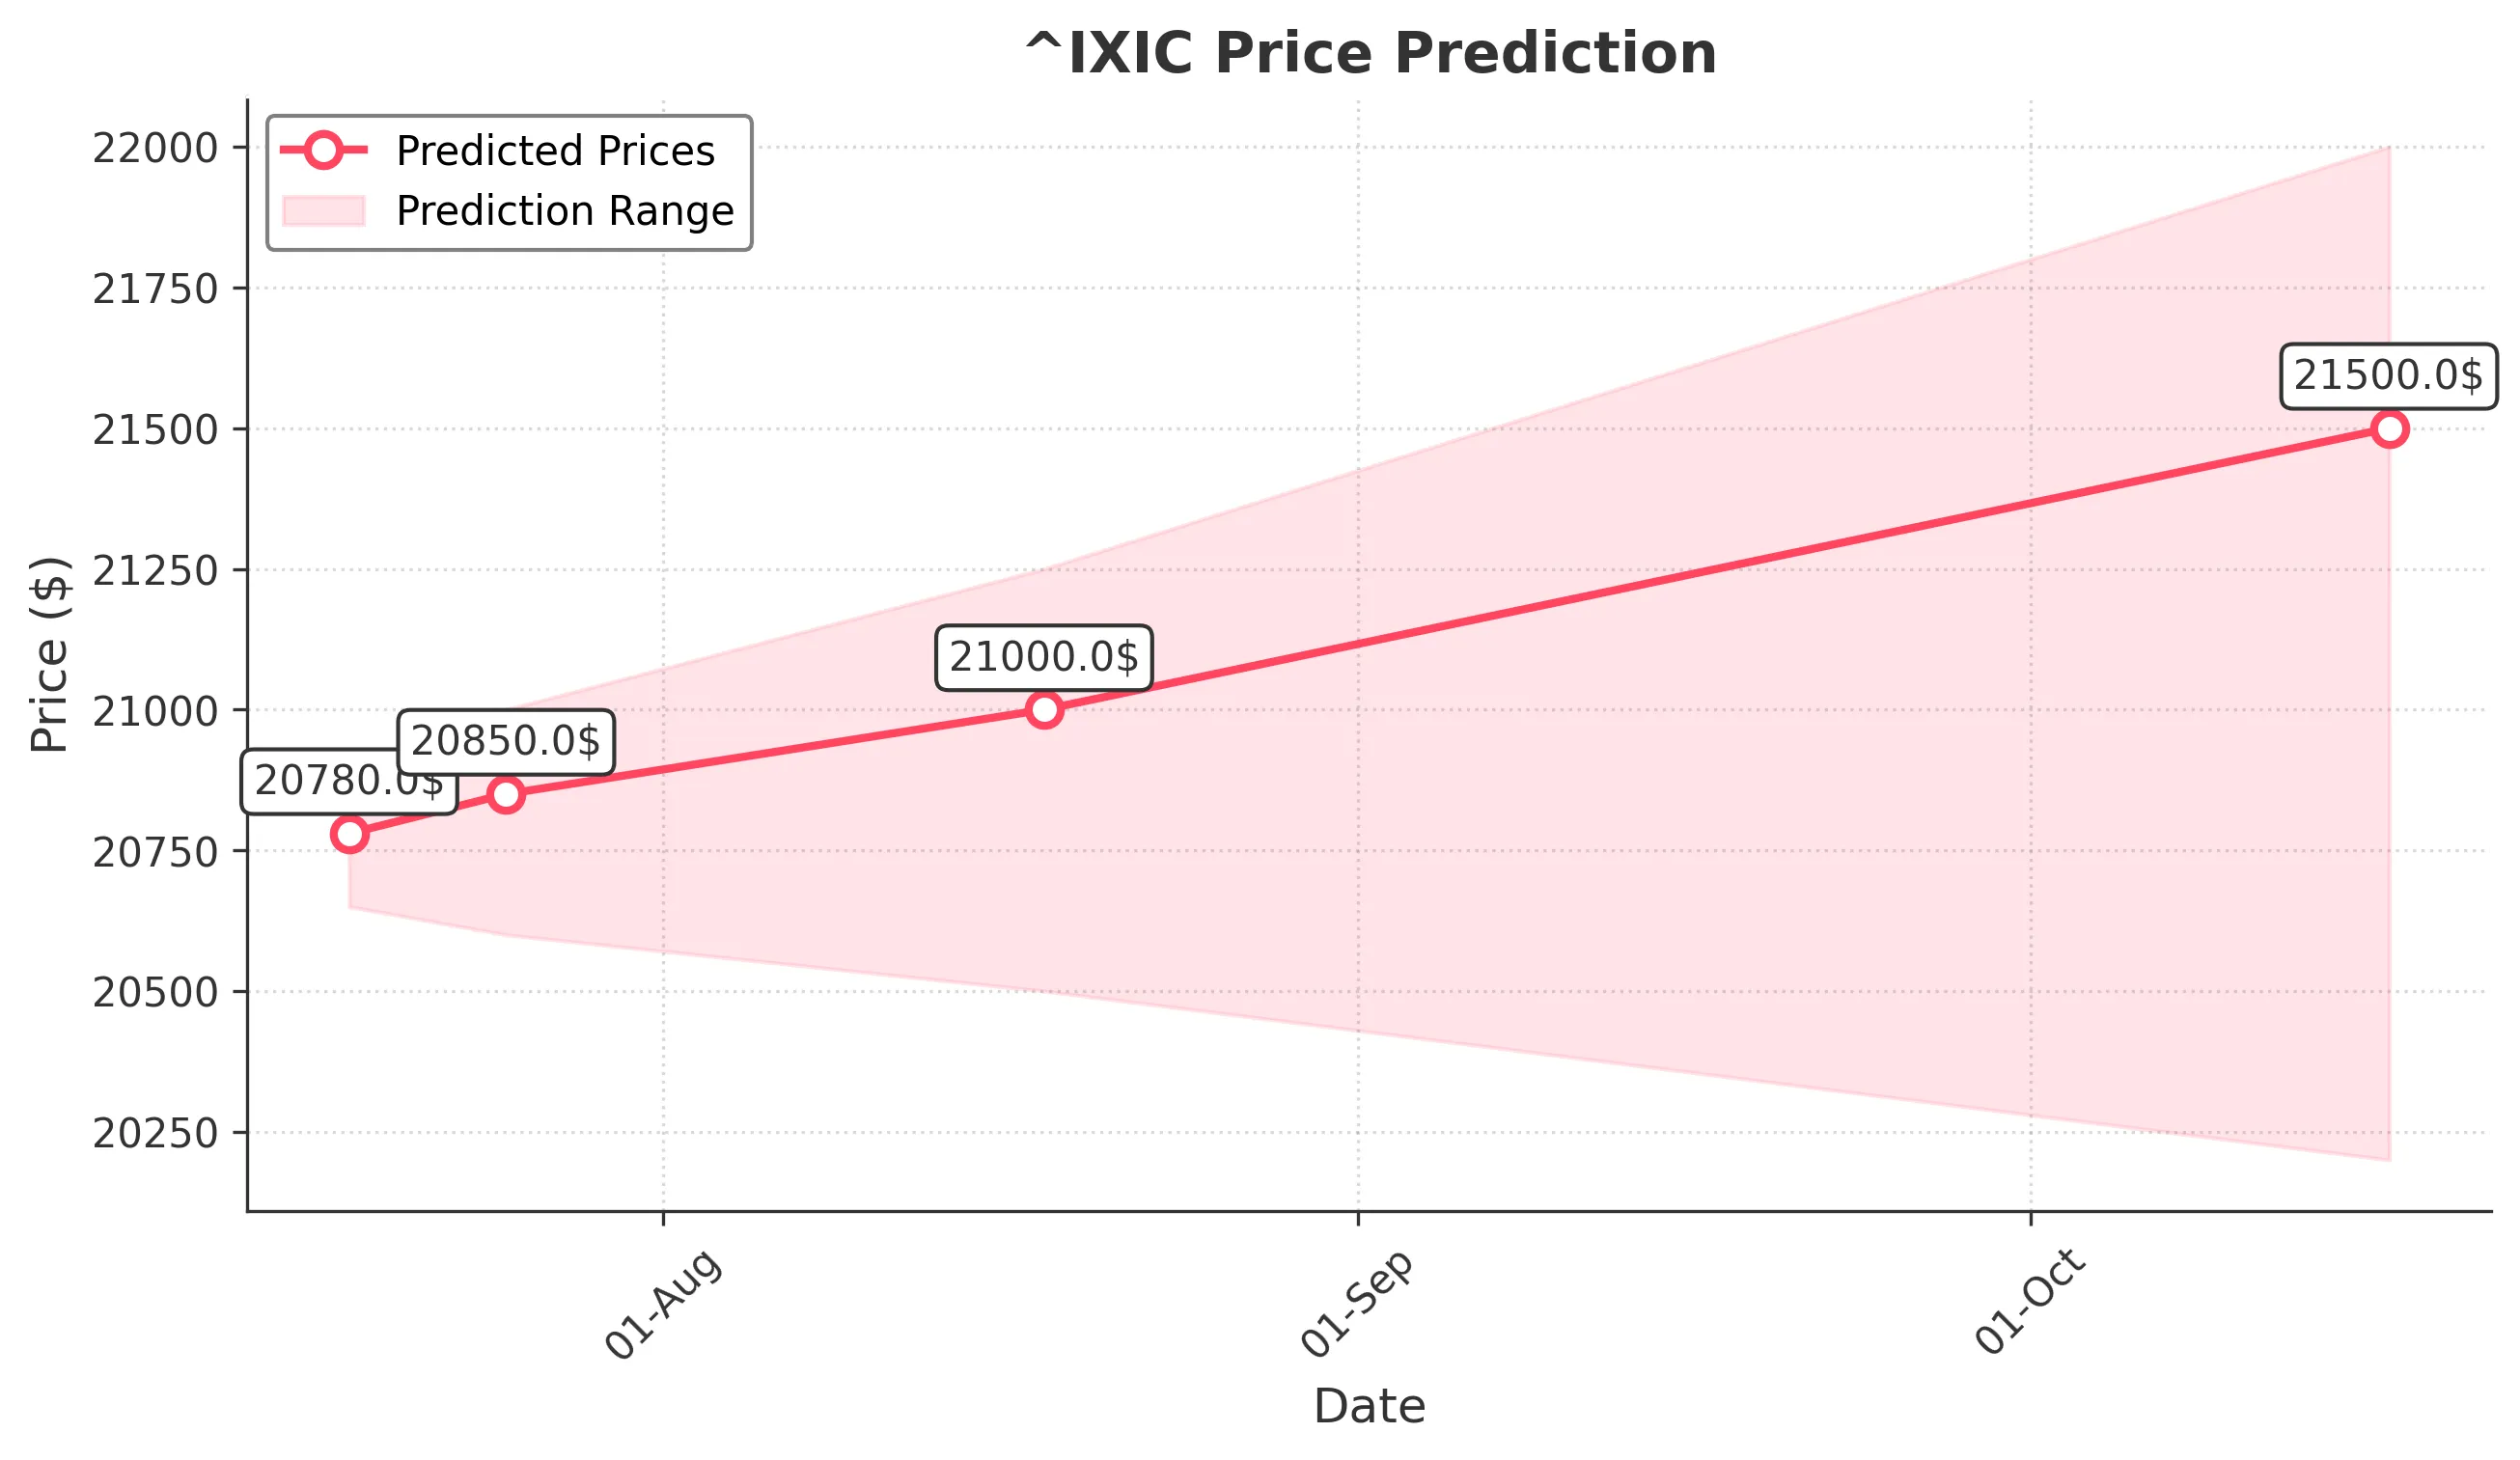
Target: July 18, 2025$20780
$20760
$20850
$20650
Description
The market shows bullish momentum with a recent upward trend. The RSI is nearing overbought levels, indicating potential for a pullback. However, strong support at 20650 suggests limited downside risk.
Analysis
The past 3 months show a bullish trend with significant upward movement. Key support at 20650 and resistance at 20850. Volume spikes indicate strong buying interest. Technical indicators like MACD and moving averages support continued upward momentum.
Confidence Level
Potential Risks
Potential for a reversal if market sentiment shifts or if macroeconomic news impacts investor confidence.
1 Week Prediction
Target: July 25, 2025$20850
$20780
$21000
$20600
Description
Continued bullish sentiment is expected, with the market likely to test resistance at 21000. However, the RSI indicates overbought conditions, suggesting a possible pullback before reaching this level.
Analysis
The stock has shown strong performance with consistent higher highs and higher lows. Key resistance at 21000 may pose challenges. Volume analysis indicates strong buying, but caution is warranted due to potential overbought conditions.
Confidence Level
Potential Risks
Market volatility and external economic factors could lead to unexpected price movements.
1 Month Prediction
Target: August 18, 2025$21000
$20850
$21250
$20500
Description
The market is expected to maintain an upward trajectory, with potential to reach 21250. However, the RSI suggests a correction may occur, leading to a test of support at 20500.
Analysis
The overall trend remains bullish, but signs of exhaustion are evident. Key support at 20500 and resistance at 21250. Volume patterns indicate strong interest, but caution is advised as the market approaches overbought territory.
Confidence Level
Potential Risks
Economic data releases and geopolitical events could impact market direction significantly.
3 Months Prediction
Target: October 17, 2025$21500
$21000
$22000
$20200
Description
Long-term bullish outlook with potential to reach 22000, driven by strong earnings and economic recovery. However, market corrections are possible, especially if macroeconomic indicators disappoint.
Analysis
The stock has shown resilience with a strong upward trend. Key support at 20200 and resistance at 22000. Technical indicators suggest bullish momentum, but external factors could introduce volatility. A balanced view is necessary as market conditions evolve.
Confidence Level
Potential Risks
Unforeseen economic downturns or changes in monetary policy could lead to significant volatility.