NSDQ Trading Predictions
1 Day Prediction
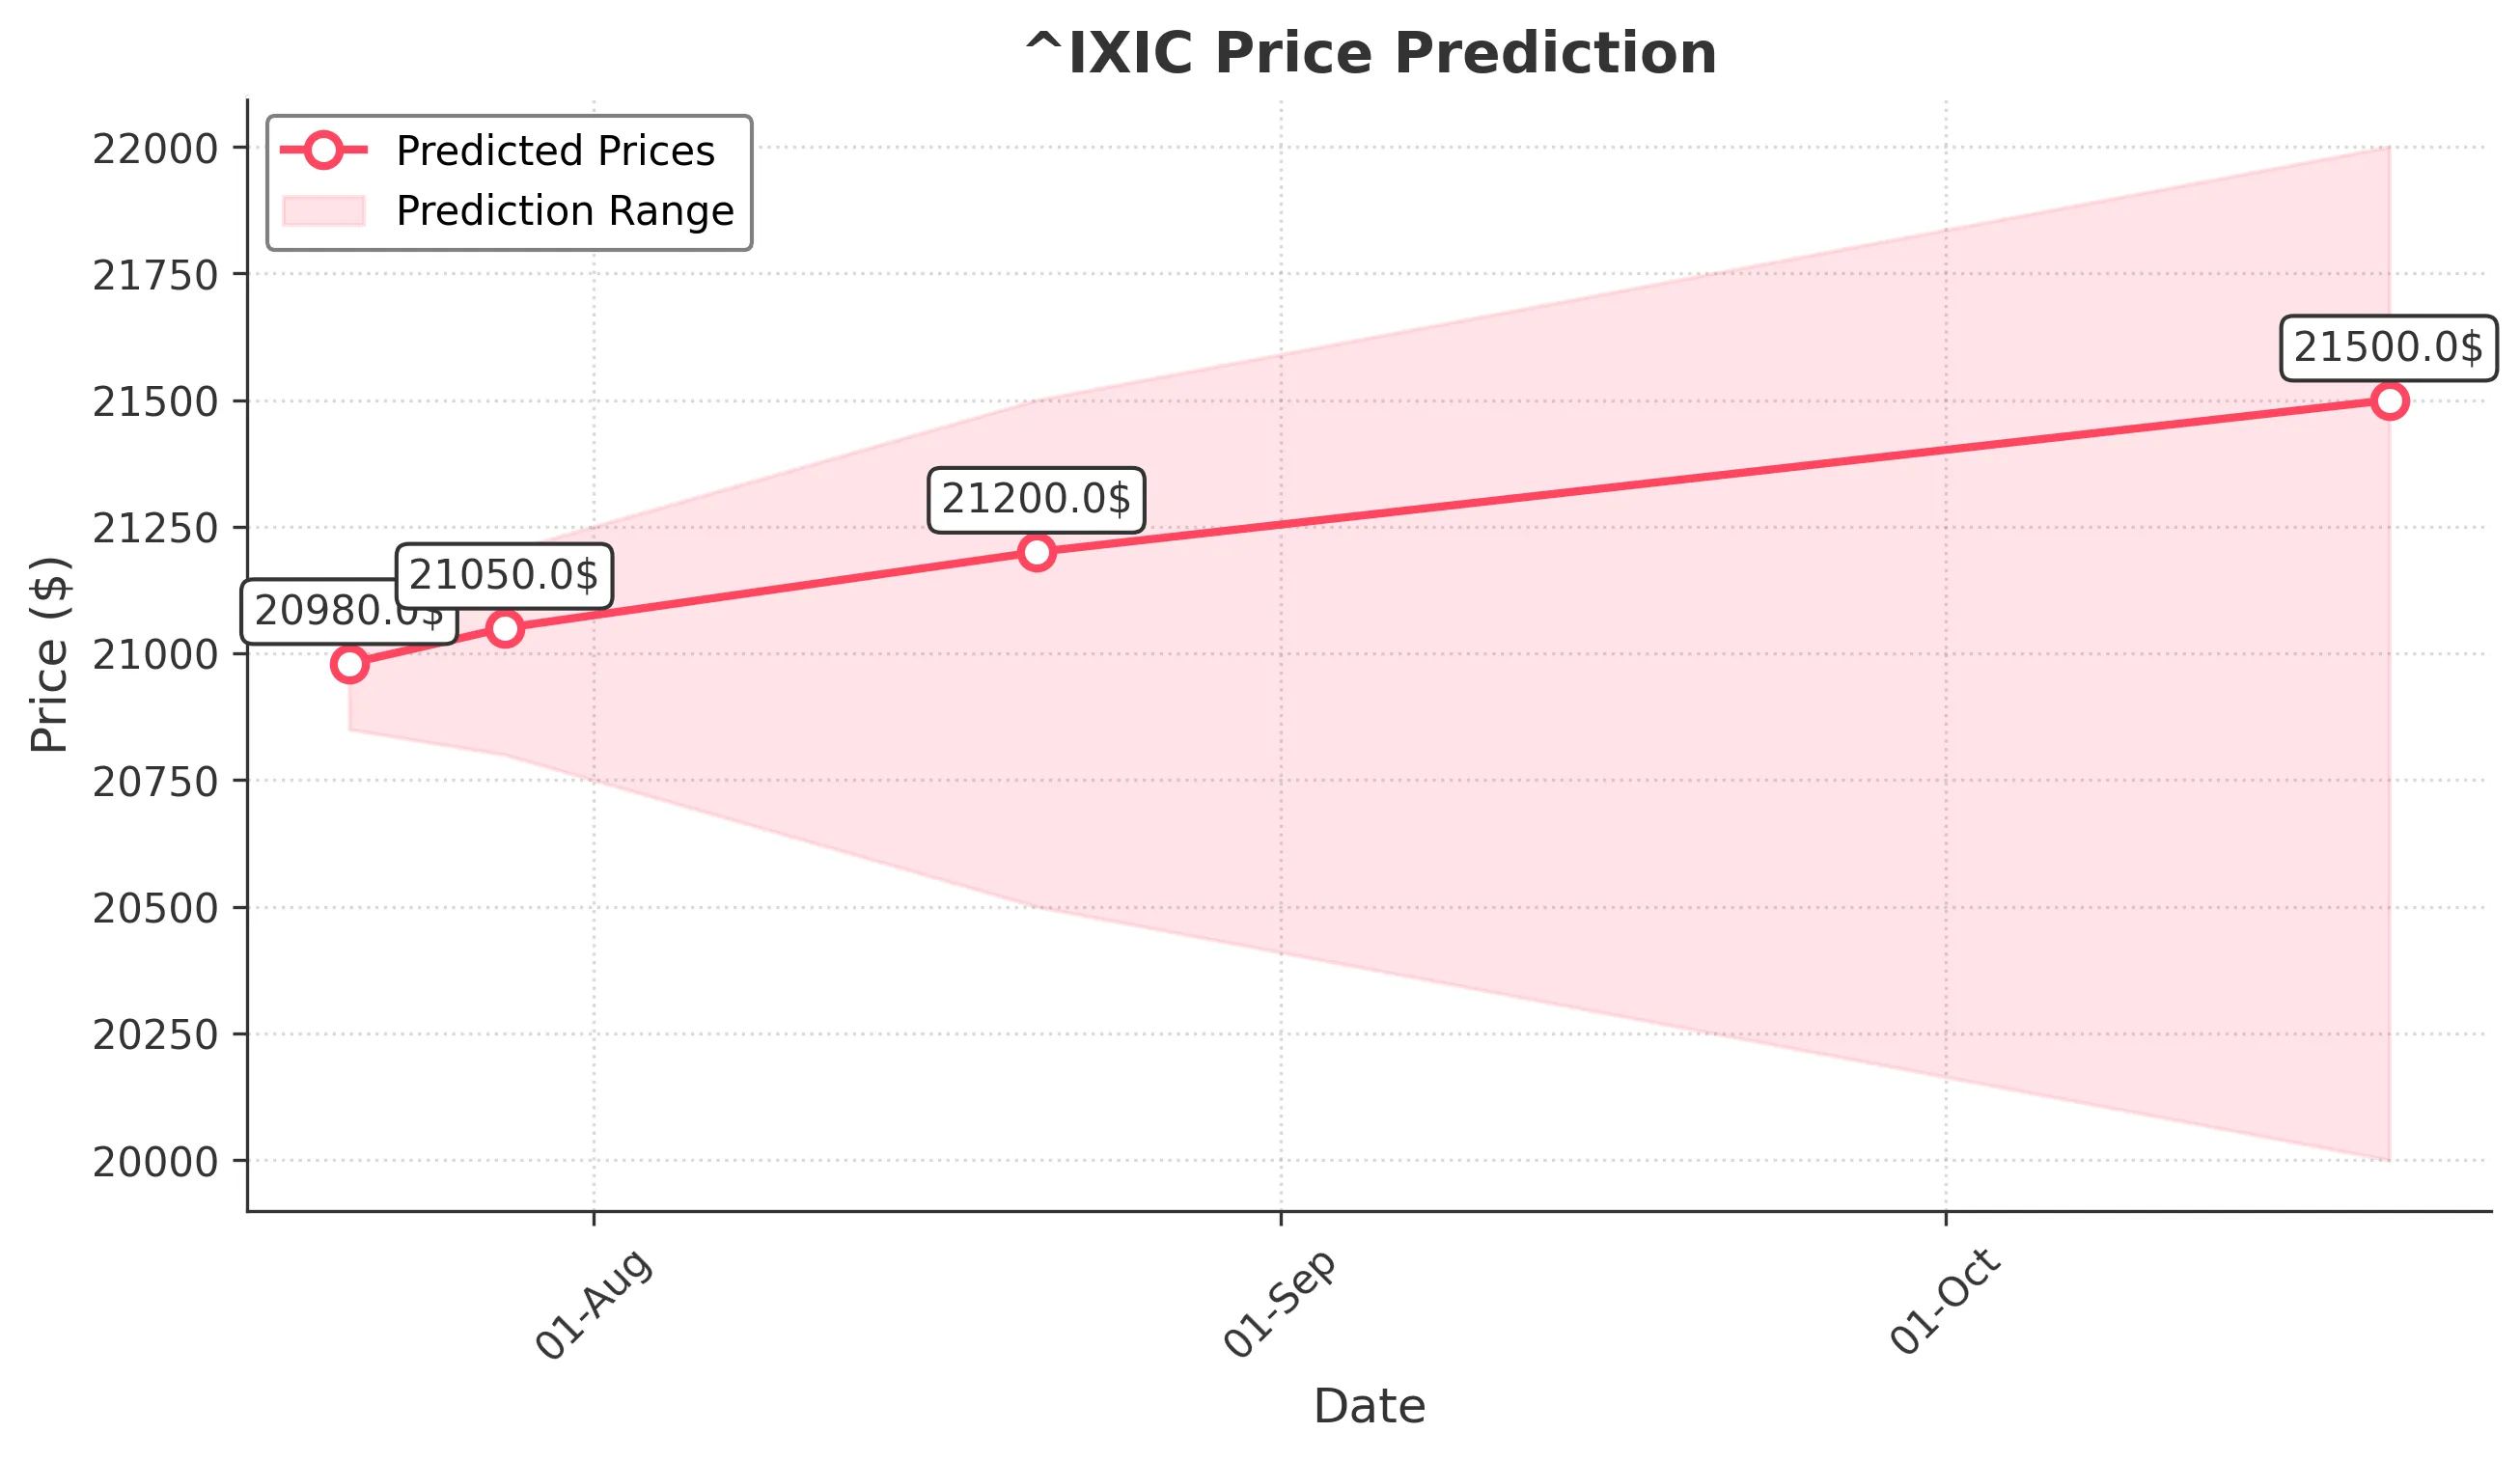
Target: July 21, 2025$20980
$20970
$21050
$20850
Description
The market shows bullish momentum with a recent upward trend. The RSI is nearing overbought levels, indicating potential for a pullback. However, strong support at 20850 suggests limited downside. Volume remains robust, supporting the upward movement.
Analysis
The past 3 months show a bullish trend with significant upward movement. Key support at 20850 and resistance at 21050. Technical indicators like MACD and moving averages confirm bullish momentum. Volume spikes indicate strong buying interest.
Confidence Level
Potential Risks
Potential for a pullback if RSI exceeds overbought levels. Market sentiment could shift due to external news.
1 Week Prediction
Target: July 28, 2025$21050
$20980
$21200
$20800
Description
The bullish trend is expected to continue, with the market likely to test resistance at 21200. However, the RSI indicates overbought conditions, suggesting a possible correction. Volume remains strong, supporting the upward trend.
Analysis
The stock has shown consistent upward movement, with key support at 20800. Technical indicators suggest bullish momentum, but caution is warranted due to overbought conditions. Volume patterns indicate strong interest.
Confidence Level
Potential Risks
Market volatility could increase, and external factors may impact sentiment, leading to potential corrections.
1 Month Prediction
Target: August 21, 2025$21200
$21000
$21500
$20500
Description
The market is expected to maintain its bullish trend, with potential to reach 21500. However, the RSI suggests a correction may occur before reaching this level. Volume trends indicate sustained interest, but caution is advised.
Analysis
The stock has shown strong bullish performance, with significant support at 20500. Technical indicators confirm upward momentum, but overbought signals suggest potential corrections. Volume patterns indicate strong buying interest.
Confidence Level
Potential Risks
Possible market corrections due to overbought conditions and external economic factors could impact predictions.
3 Months Prediction
Target: October 21, 2025$21500
$21000
$22000
$20000
Description
The market may continue its upward trajectory, potentially reaching 22000. However, macroeconomic factors and market sentiment could lead to volatility. The RSI indicates potential overbought conditions, suggesting caution.
Analysis
The stock has shown a strong bullish trend, but potential resistance at 22000 and macroeconomic factors could lead to volatility. Technical indicators suggest caution due to overbought conditions, and volume patterns indicate strong interest.
Confidence Level
Potential Risks
Unforeseen economic events or shifts in market sentiment could lead to significant volatility and impact predictions.