NSDQ Trading Predictions
1 Day Prediction
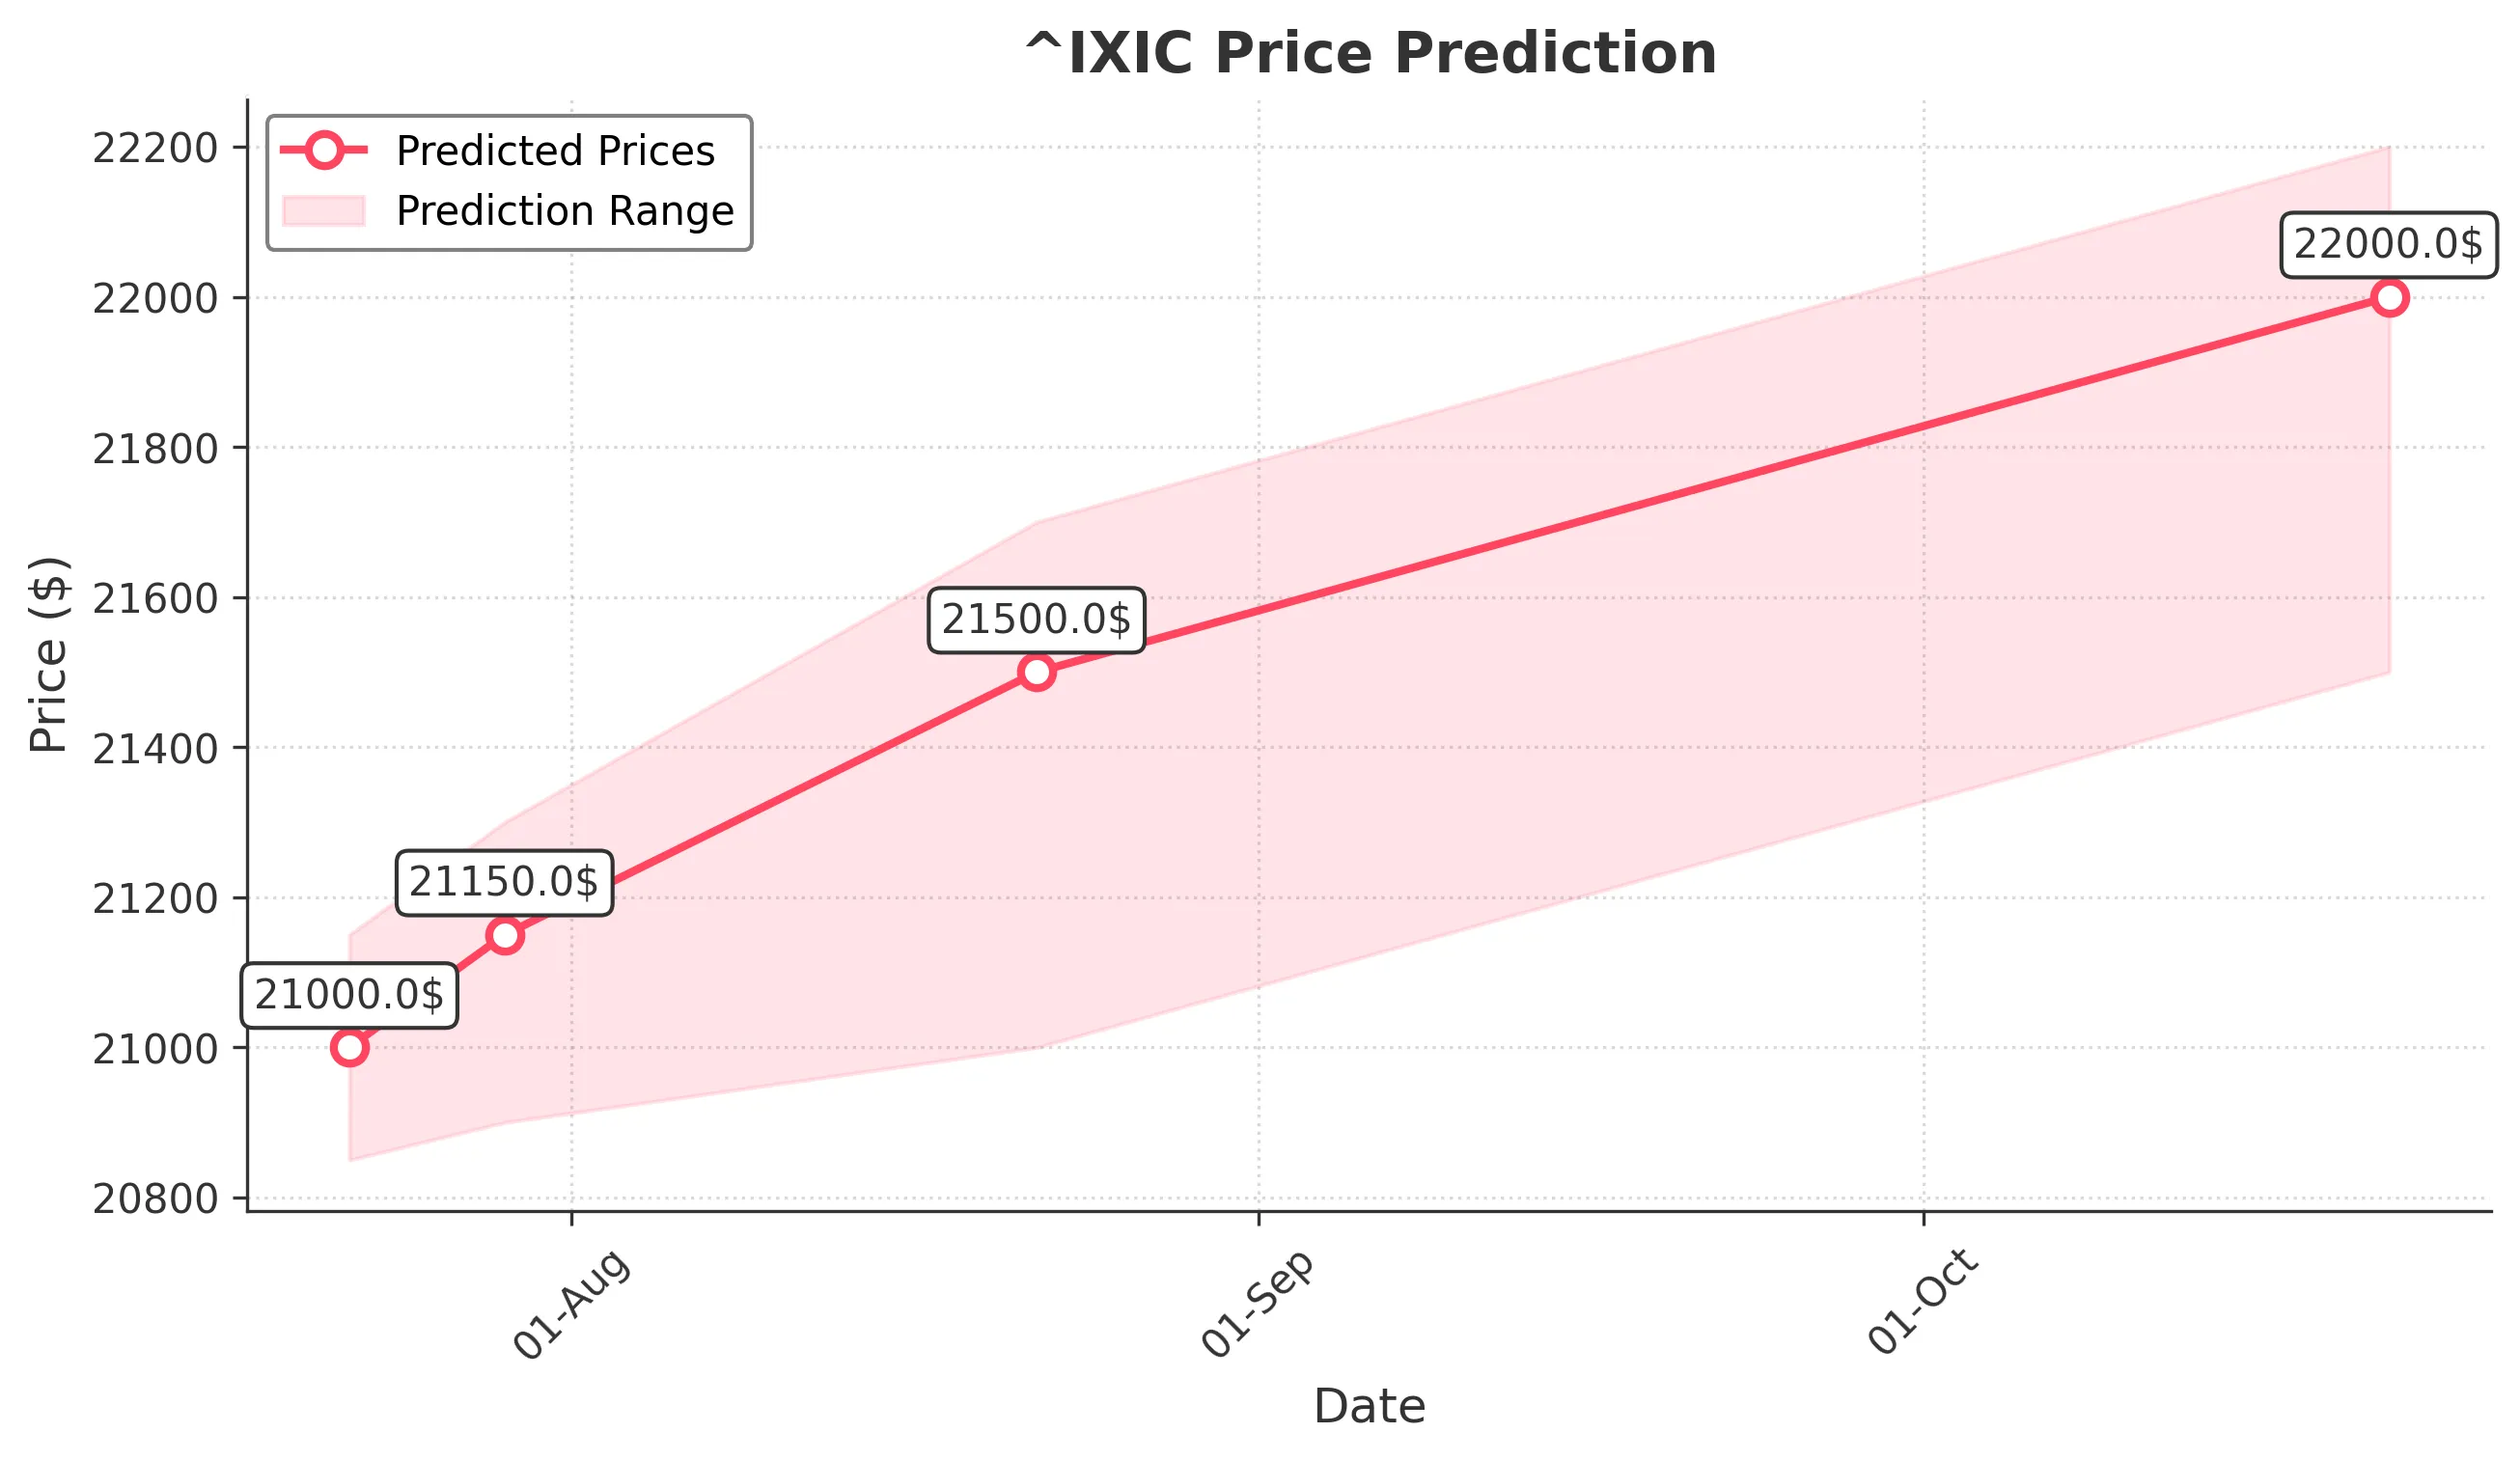
Target: July 22, 2025$21000
$20990
$21150
$20850
Description
The market shows bullish momentum with a recent upward trend. The RSI is nearing overbought levels, indicating potential for a pullback. However, strong volume suggests continued buying interest. Expect a slight increase in price.
Analysis
The past 3 months show a bullish trend with significant upward movement. Key support at 20800 and resistance at 21050. Volume has been strong, indicating robust buying. Technical indicators like MACD are positive, but RSI suggests caution.
Confidence Level
Potential Risks
Potential for a pullback if RSI exceeds overbought levels. Market sentiment could shift due to external news.
1 Week Prediction
Target: July 29, 2025$21150
$21000
$21300
$20900
Description
The bullish trend is expected to continue, supported by strong volume and positive market sentiment. However, the RSI indicates potential overbought conditions, which could lead to volatility.
Analysis
The index has shown consistent upward movement, with key resistance at 21200. Volume spikes indicate strong interest. Technical indicators are bullish, but caution is warranted as the market approaches overbought territory.
Confidence Level
Potential Risks
Market corrections could occur if profit-taking happens. External economic factors may also influence price.
1 Month Prediction
Target: August 22, 2025$21500
$21150
$21700
$21000
Description
Continued bullish momentum is anticipated, with strong support levels. However, the market may face resistance at 21600, and profit-taking could lead to short-term corrections.
Analysis
The index has been on a strong upward trajectory, with significant support at 21000. Technical indicators remain bullish, but the market is approaching overbought conditions, suggesting a need for caution.
Confidence Level
Potential Risks
Potential for market corrections if economic data disappoints. External geopolitical events could also impact sentiment.
3 Months Prediction
Target: October 22, 2025$22000
$21800
$22200
$21500
Description
Long-term bullish outlook supported by strong fundamentals and market sentiment. However, potential economic headwinds could create volatility.
Analysis
The index has shown a strong bullish trend over the past months, with key support at 21500. While technical indicators are positive, external factors could introduce volatility. A balanced view is necessary as the market approaches potential resistance levels.
Confidence Level
Potential Risks
Economic indicators and geopolitical events may lead to unexpected volatility. Market corrections are possible.