NSDQ Trading Predictions
1 Day Prediction
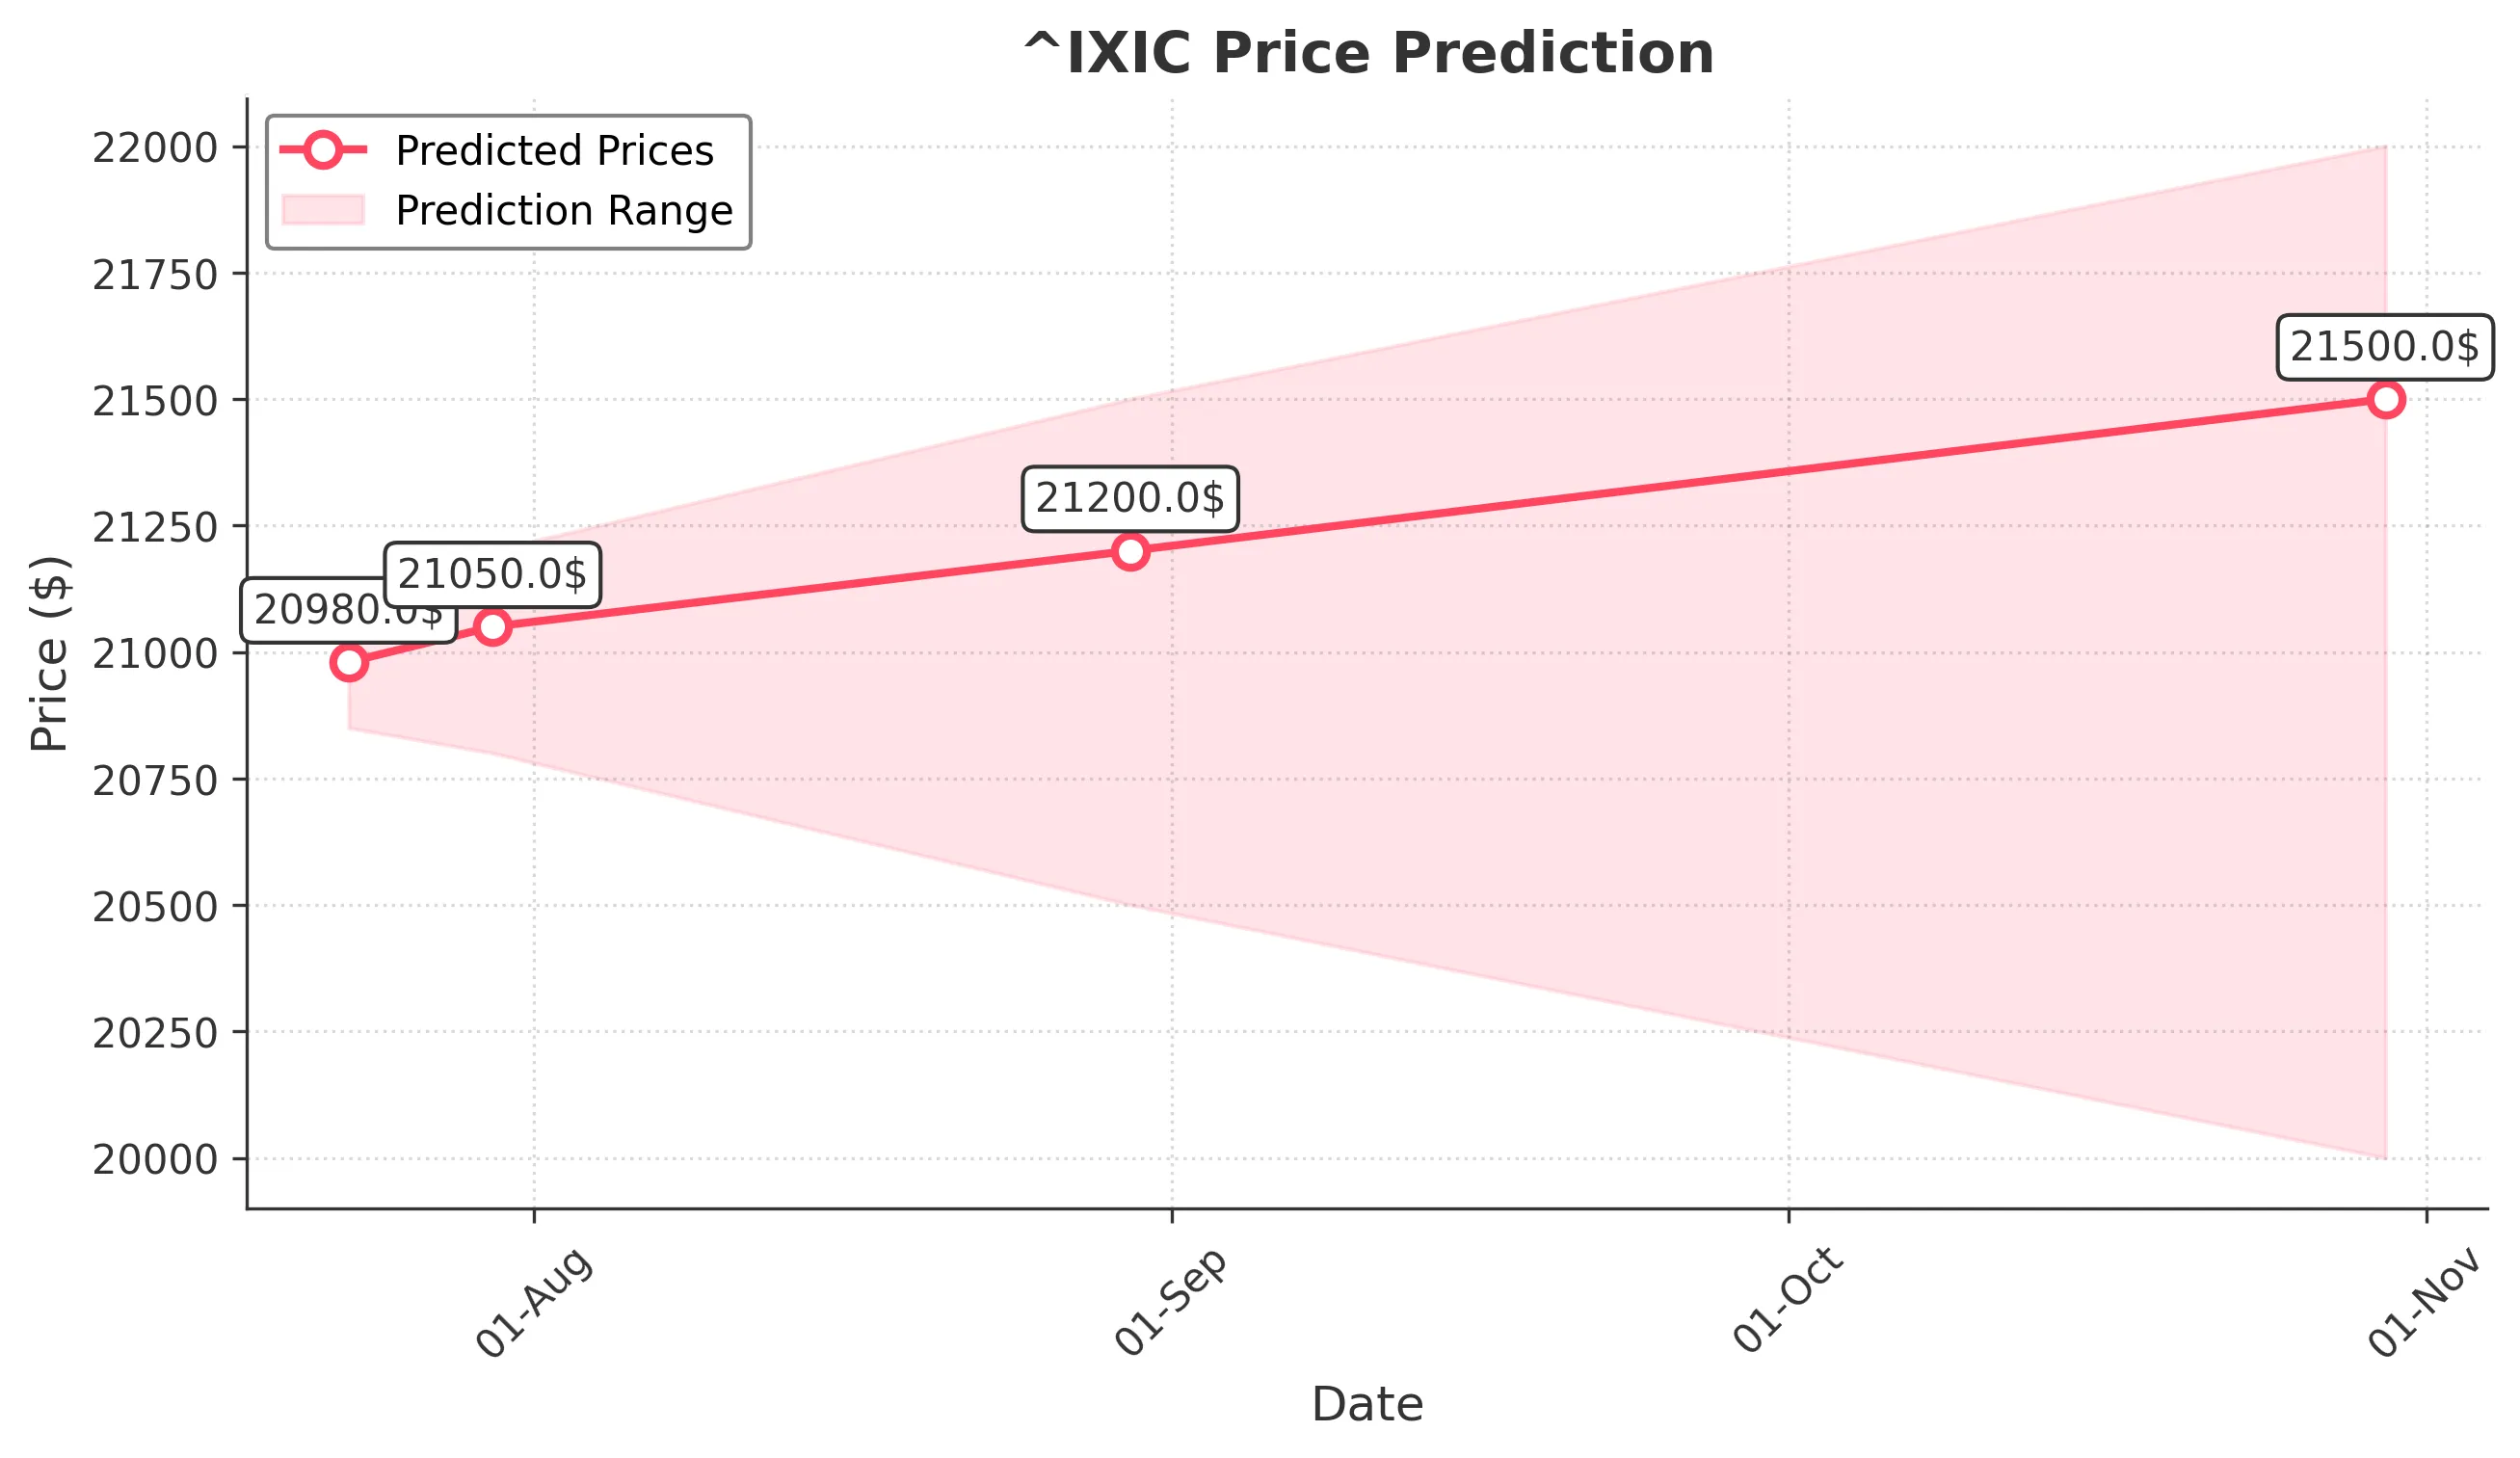
Target: July 23, 2025$20980
$20960
$21050
$20850
Description
The market shows bullish momentum with a recent upward trend. The RSI is nearing overbought levels, indicating potential for a pullback. However, strong support at 20850 and resistance at 21050 suggest a stable close around 20980.
Analysis
The past 3 months show a bullish trend with significant upward movement. Key support at 20850 and resistance at 21050 are critical. The MACD indicates bullish momentum, while volume spikes suggest strong buying interest. However, RSI nearing overbought levels raises caution.
Confidence Level
Potential Risks
Potential volatility due to macroeconomic news could impact the prediction.
1 Week Prediction
Target: July 30, 2025$21050
$20980
$21200
$20800
Description
The bullish trend is expected to continue, with the market likely to test resistance at 21200. The MACD remains positive, and volume trends support upward movement. However, a pullback could occur if RSI exceeds overbought levels.
Analysis
The stock has shown consistent upward movement, with key support at 20800. The MACD and moving averages indicate bullish momentum, while volume patterns suggest strong buying. However, potential resistance at 21200 could lead to a short-term pullback.
Confidence Level
Potential Risks
Market sentiment could shift due to external economic factors, leading to unexpected volatility.
1 Month Prediction
Target: August 30, 2025$21200
$21050
$21500
$20500
Description
The market is expected to maintain its bullish trend, with a target close around 21200. The Fibonacci retracement levels support this upward movement, but caution is advised as the RSI may indicate overbought conditions.
Analysis
The stock has been on a bullish trajectory, with significant support at 20500. The MACD and moving averages confirm this trend, while volume analysis shows strong buying interest. However, potential resistance at 21500 may lead to a correction.
Confidence Level
Potential Risks
Economic data releases and geopolitical events could introduce volatility, impacting the forecast.
3 Months Prediction
Target: October 30, 2025$21500
$21200
$22000
$20000
Description
The stock is projected to continue its upward trend, potentially reaching 21500. However, market volatility and economic conditions could lead to fluctuations. The RSI indicates potential overbought conditions, warranting caution.
Analysis
Over the past 3 months, the stock has shown a strong bullish trend, with key support at 20000. The MACD and moving averages indicate continued upward momentum, but potential resistance at 22000 could lead to a pullback. Market sentiment remains cautiously optimistic.
Confidence Level
Potential Risks
Unforeseen economic events or market corrections could significantly impact the forecast.