NSDQ Trading Predictions
1 Day Prediction
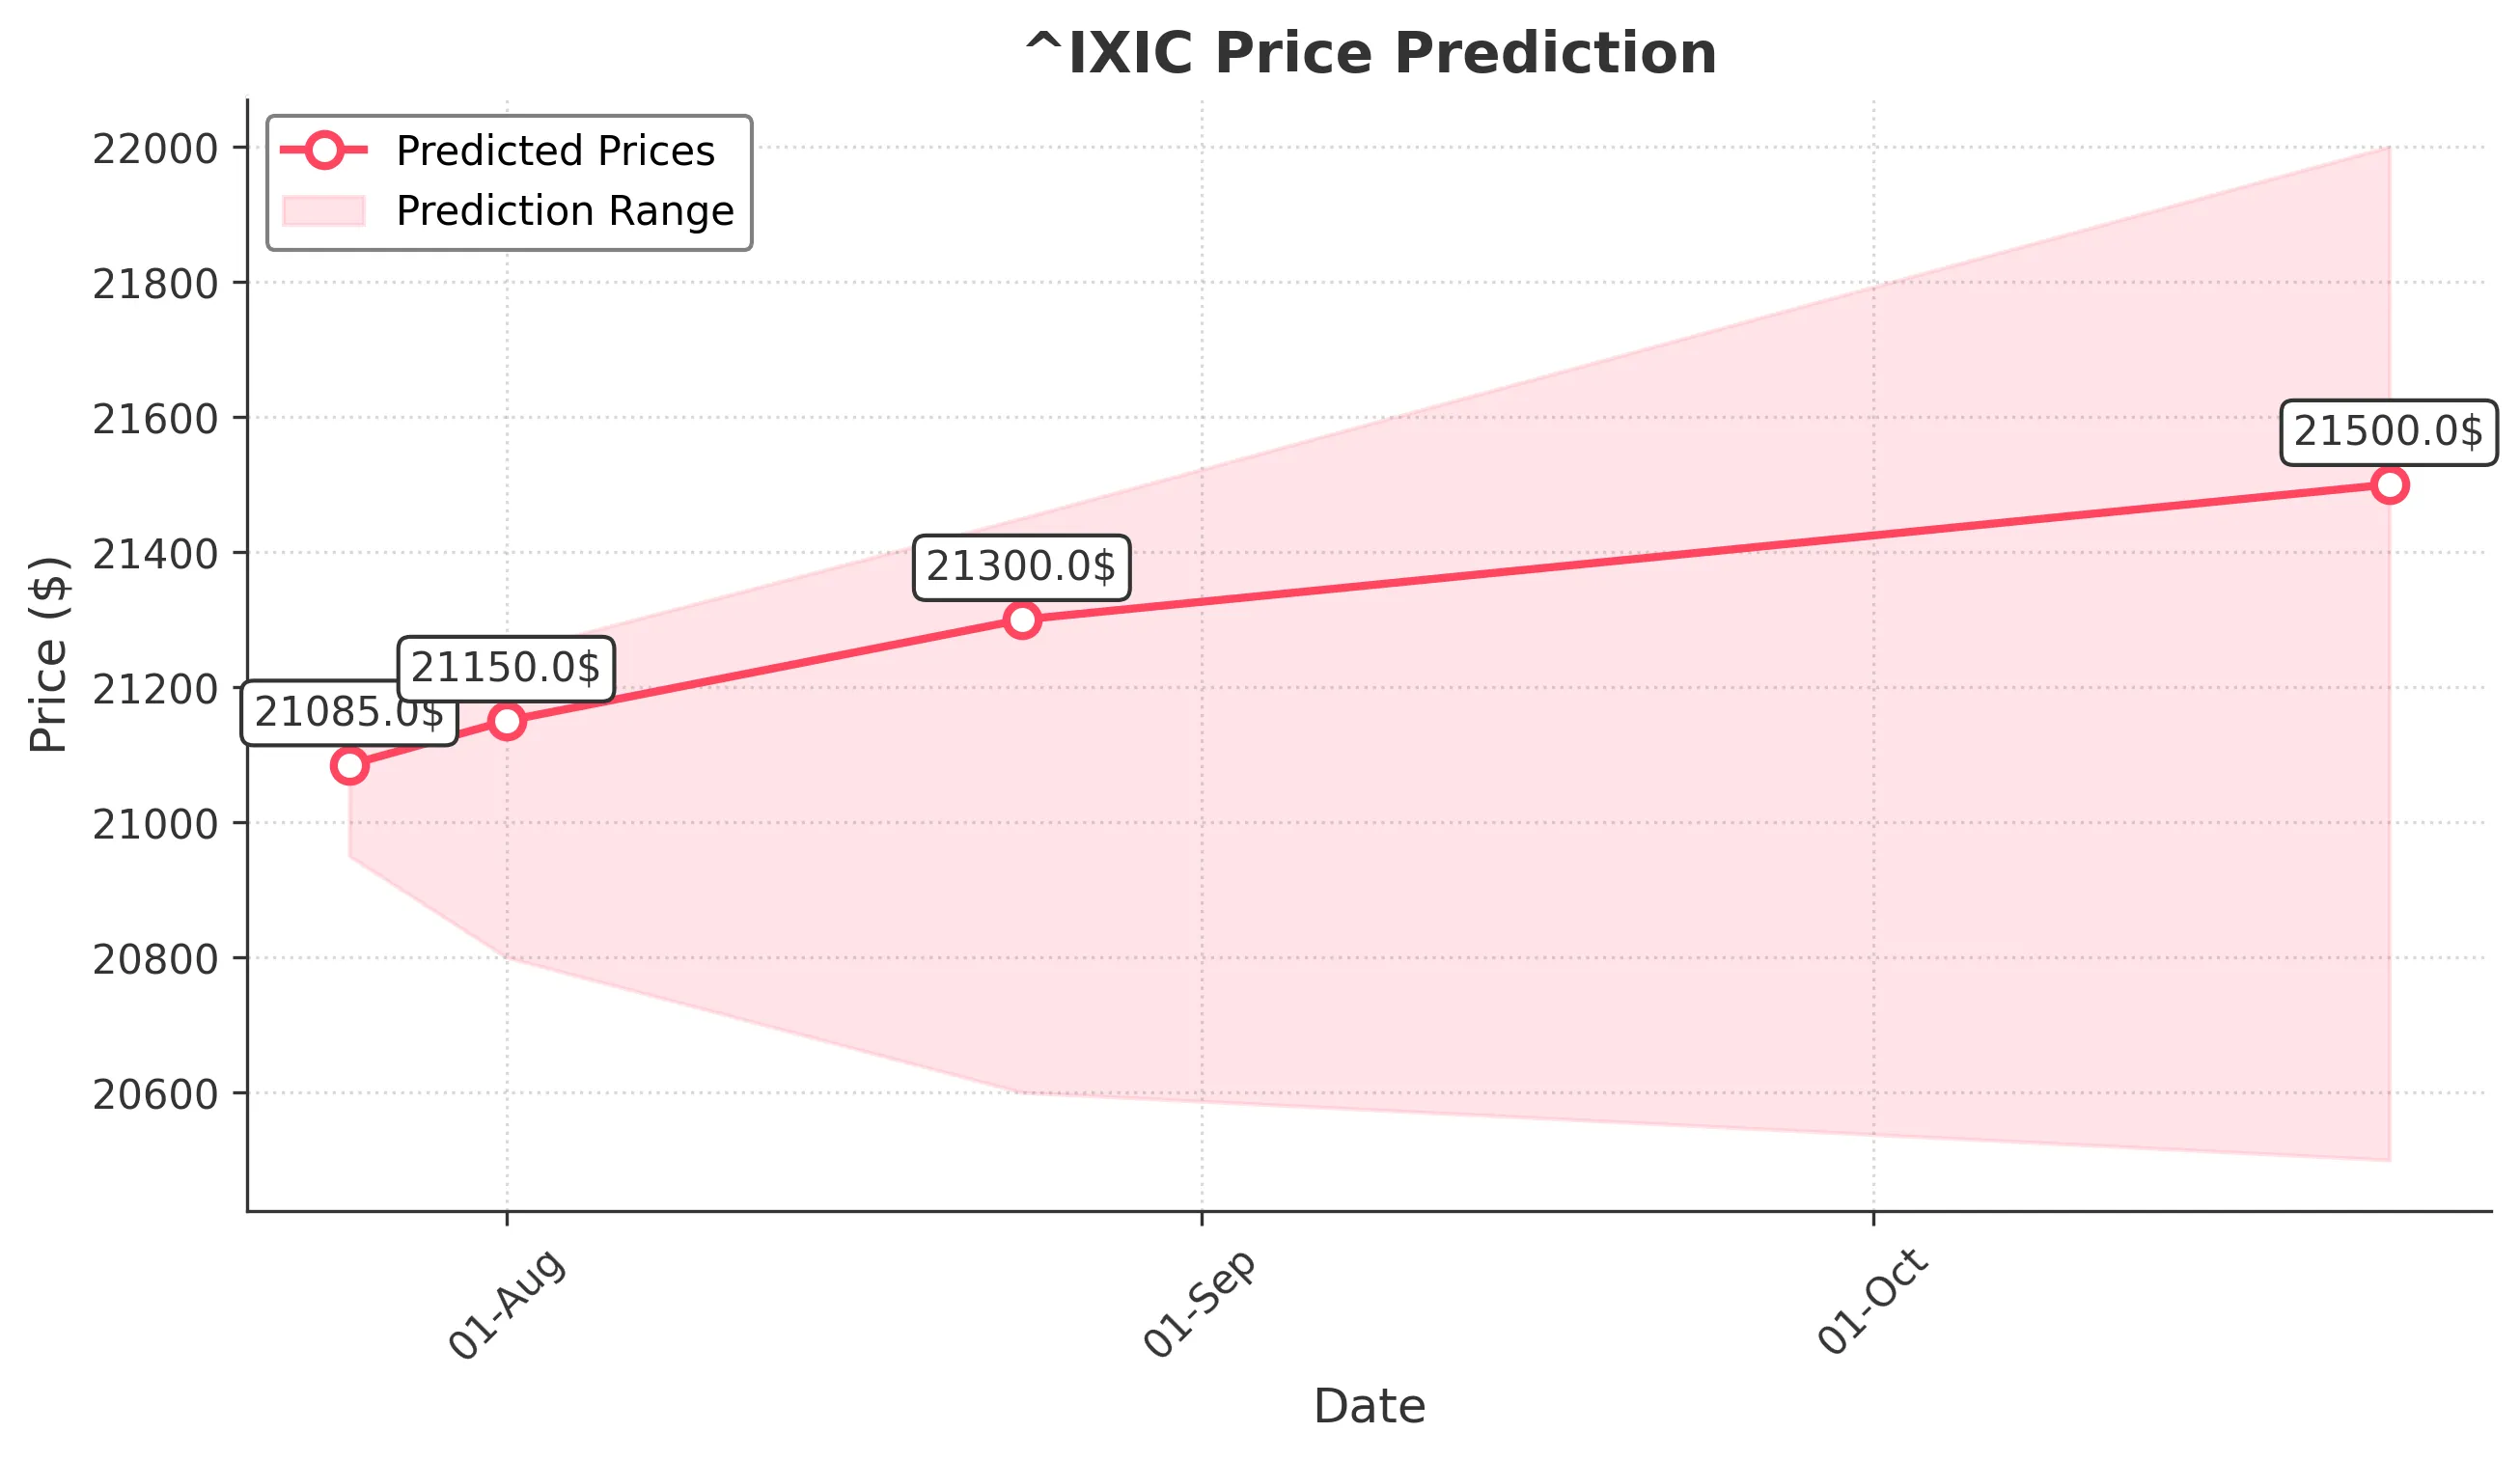
Target: July 25, 2025$21085
$21080
$21150
$20950
Description
The market shows bullish momentum with a recent upward trend. The RSI is nearing overbought levels, indicating potential for a pullback. However, strong support at 20950 suggests limited downside risk. Volume remains robust, supporting the upward movement.
Analysis
The past 3 months show a bullish trend with significant upward movement. Key support at 20950 and resistance at 21150. The MACD indicates bullish momentum, while volume spikes suggest strong buying interest. However, caution is warranted as the RSI approaches overbought territory.
Confidence Level
Potential Risks
Potential for a short-term pullback exists due to overbought RSI conditions. Market sentiment could shift with external news.
1 Week Prediction
Target: August 1, 2025$21150
$21090
$21250
$20800
Description
The bullish trend is expected to continue, supported by strong buying volume. However, the RSI indicates potential overbought conditions, suggesting a possible pullback. Key resistance at 21250 may limit upside in the short term.
Analysis
The stock has shown consistent upward movement, with significant support at 20800. The MACD remains bullish, and volume patterns indicate strong interest. However, the RSI nearing overbought levels raises concerns about sustainability.
Confidence Level
Potential Risks
Market volatility and external economic factors could impact the prediction. A reversal is possible if bearish news emerges.
1 Month Prediction
Target: August 24, 2025$21300
$21100
$21450
$20600
Description
The market is expected to maintain a bullish trend, with strong support at 20600. The MACD indicates continued upward momentum, but the RSI suggests caution as it approaches overbought levels. A potential correction could occur if resistance at 21450 is tested.
Analysis
The stock has shown a strong bullish trend over the past months, with key support at 20600 and resistance at 21450. The MACD remains positive, but the RSI indicates potential overbought conditions. Volume patterns suggest sustained interest, but caution is advised.
Confidence Level
Potential Risks
External economic events or shifts in market sentiment could lead to volatility. A correction is possible if the market becomes overextended.
3 Months Prediction
Target: October 24, 2025$21500
$21200
$22000
$20500
Description
The bullish trend is expected to persist, with potential for new highs. However, the market may face resistance at 22000. The RSI indicates overbought conditions, suggesting a possible correction. Strong support at 20500 will be crucial.
Analysis
The stock has shown a strong upward trajectory, with key support at 20500 and resistance at 22000. The MACD remains bullish, but the RSI indicates potential overbought conditions. Volume patterns suggest strong interest, but caution is warranted as external factors may impact performance.
Confidence Level
Potential Risks
Market volatility and external economic factors could lead to significant fluctuations. A correction is likely if the market becomes too overextended.