NSDQ Trading Predictions
1 Day Prediction
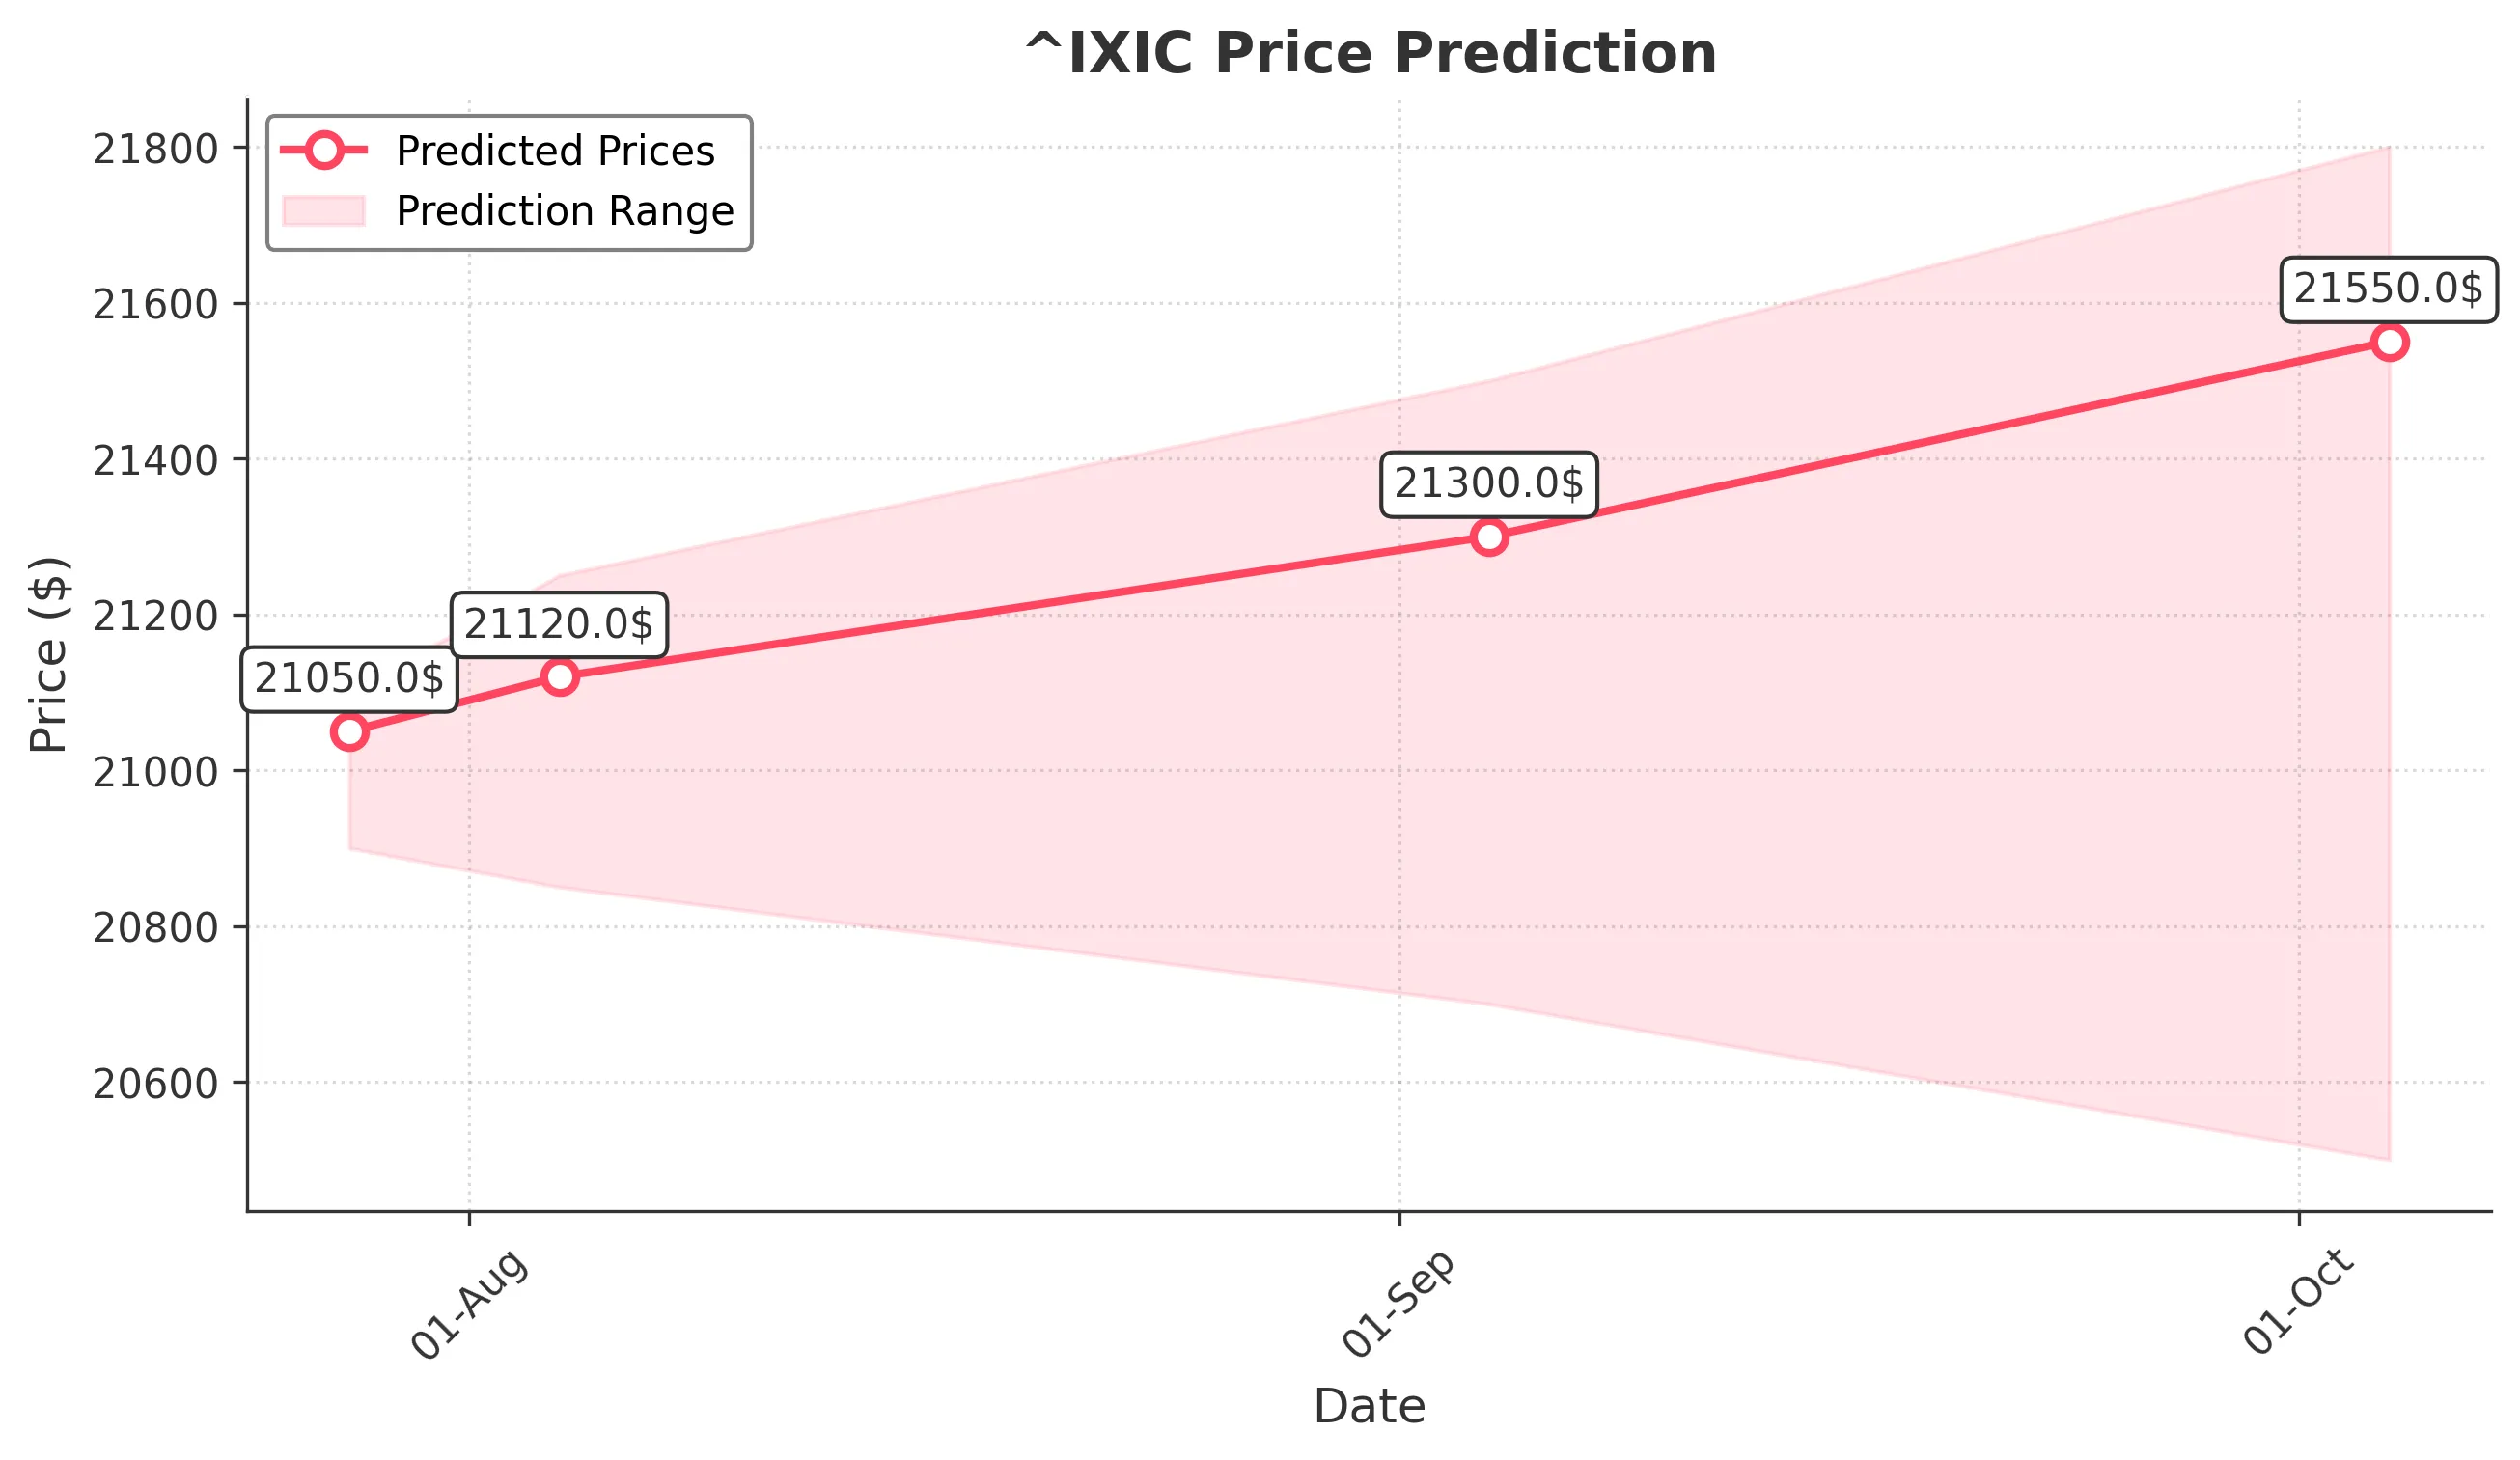
Target: July 28, 2025$21050
$21040
$21100
$20900
Description
The market shows bullish momentum with a recent upward trend. The RSI is nearing overbought levels, indicating potential for a pullback. However, strong support at 20900 may hold. Volume remains robust, suggesting continued interest.
Analysis
The past 3 months show a bullish trend with significant upward movement. Key support at 20900 and resistance at 21100. Volume spikes indicate strong buying interest. Technical indicators like MACD are positive, but RSI suggests caution.
Confidence Level
Potential Risks
Potential for a pullback if RSI exceeds overbought levels. Market sentiment could shift due to external news.
1 Week Prediction
Target: August 4, 2025$21120
$21050
$21250
$20850
Description
The bullish trend is expected to continue, supported by strong volume and positive market sentiment. However, the RSI indicates potential overbought conditions, which could lead to volatility. Watch for resistance at 21250.
Analysis
The stock has shown consistent upward movement, with key support at 20900. The MACD remains bullish, but the RSI is approaching overbought territory. Volume patterns suggest strong buying interest, but caution is warranted.
Confidence Level
Potential Risks
Market volatility could increase if external factors impact sentiment. A correction may occur if RSI remains high.
1 Month Prediction
Target: September 4, 2025$21300
$21120
$21500
$20700
Description
Expect continued bullish momentum, with potential for new highs. However, the market may face resistance at 21500. The RSI indicates a need for caution as it approaches overbought levels.
Analysis
The stock has maintained a strong upward trend, with significant support at 20700. Technical indicators are generally positive, but the RSI suggests caution. Volume remains strong, indicating sustained interest.
Confidence Level
Potential Risks
External economic factors or earnings reports could impact market sentiment. A correction is possible if overbought conditions persist.
3 Months Prediction
Target: October 4, 2025$21550
$21300
$21800
$20500
Description
The bullish trend may continue, but potential market corrections could occur. Watch for resistance at 21800. The RSI indicates overbought conditions, suggesting a possible pullback.
Analysis
The stock has shown a strong bullish trend, but the potential for corrections exists. Key support at 20500 and resistance at 21800. Technical indicators are mixed, with the MACD showing bullish signals but RSI indicating overbought conditions.
Confidence Level
Potential Risks
Market volatility and external economic events could significantly impact predictions. A downturn is possible if sentiment shifts.