NSDQ Trading Predictions
1 Day Prediction
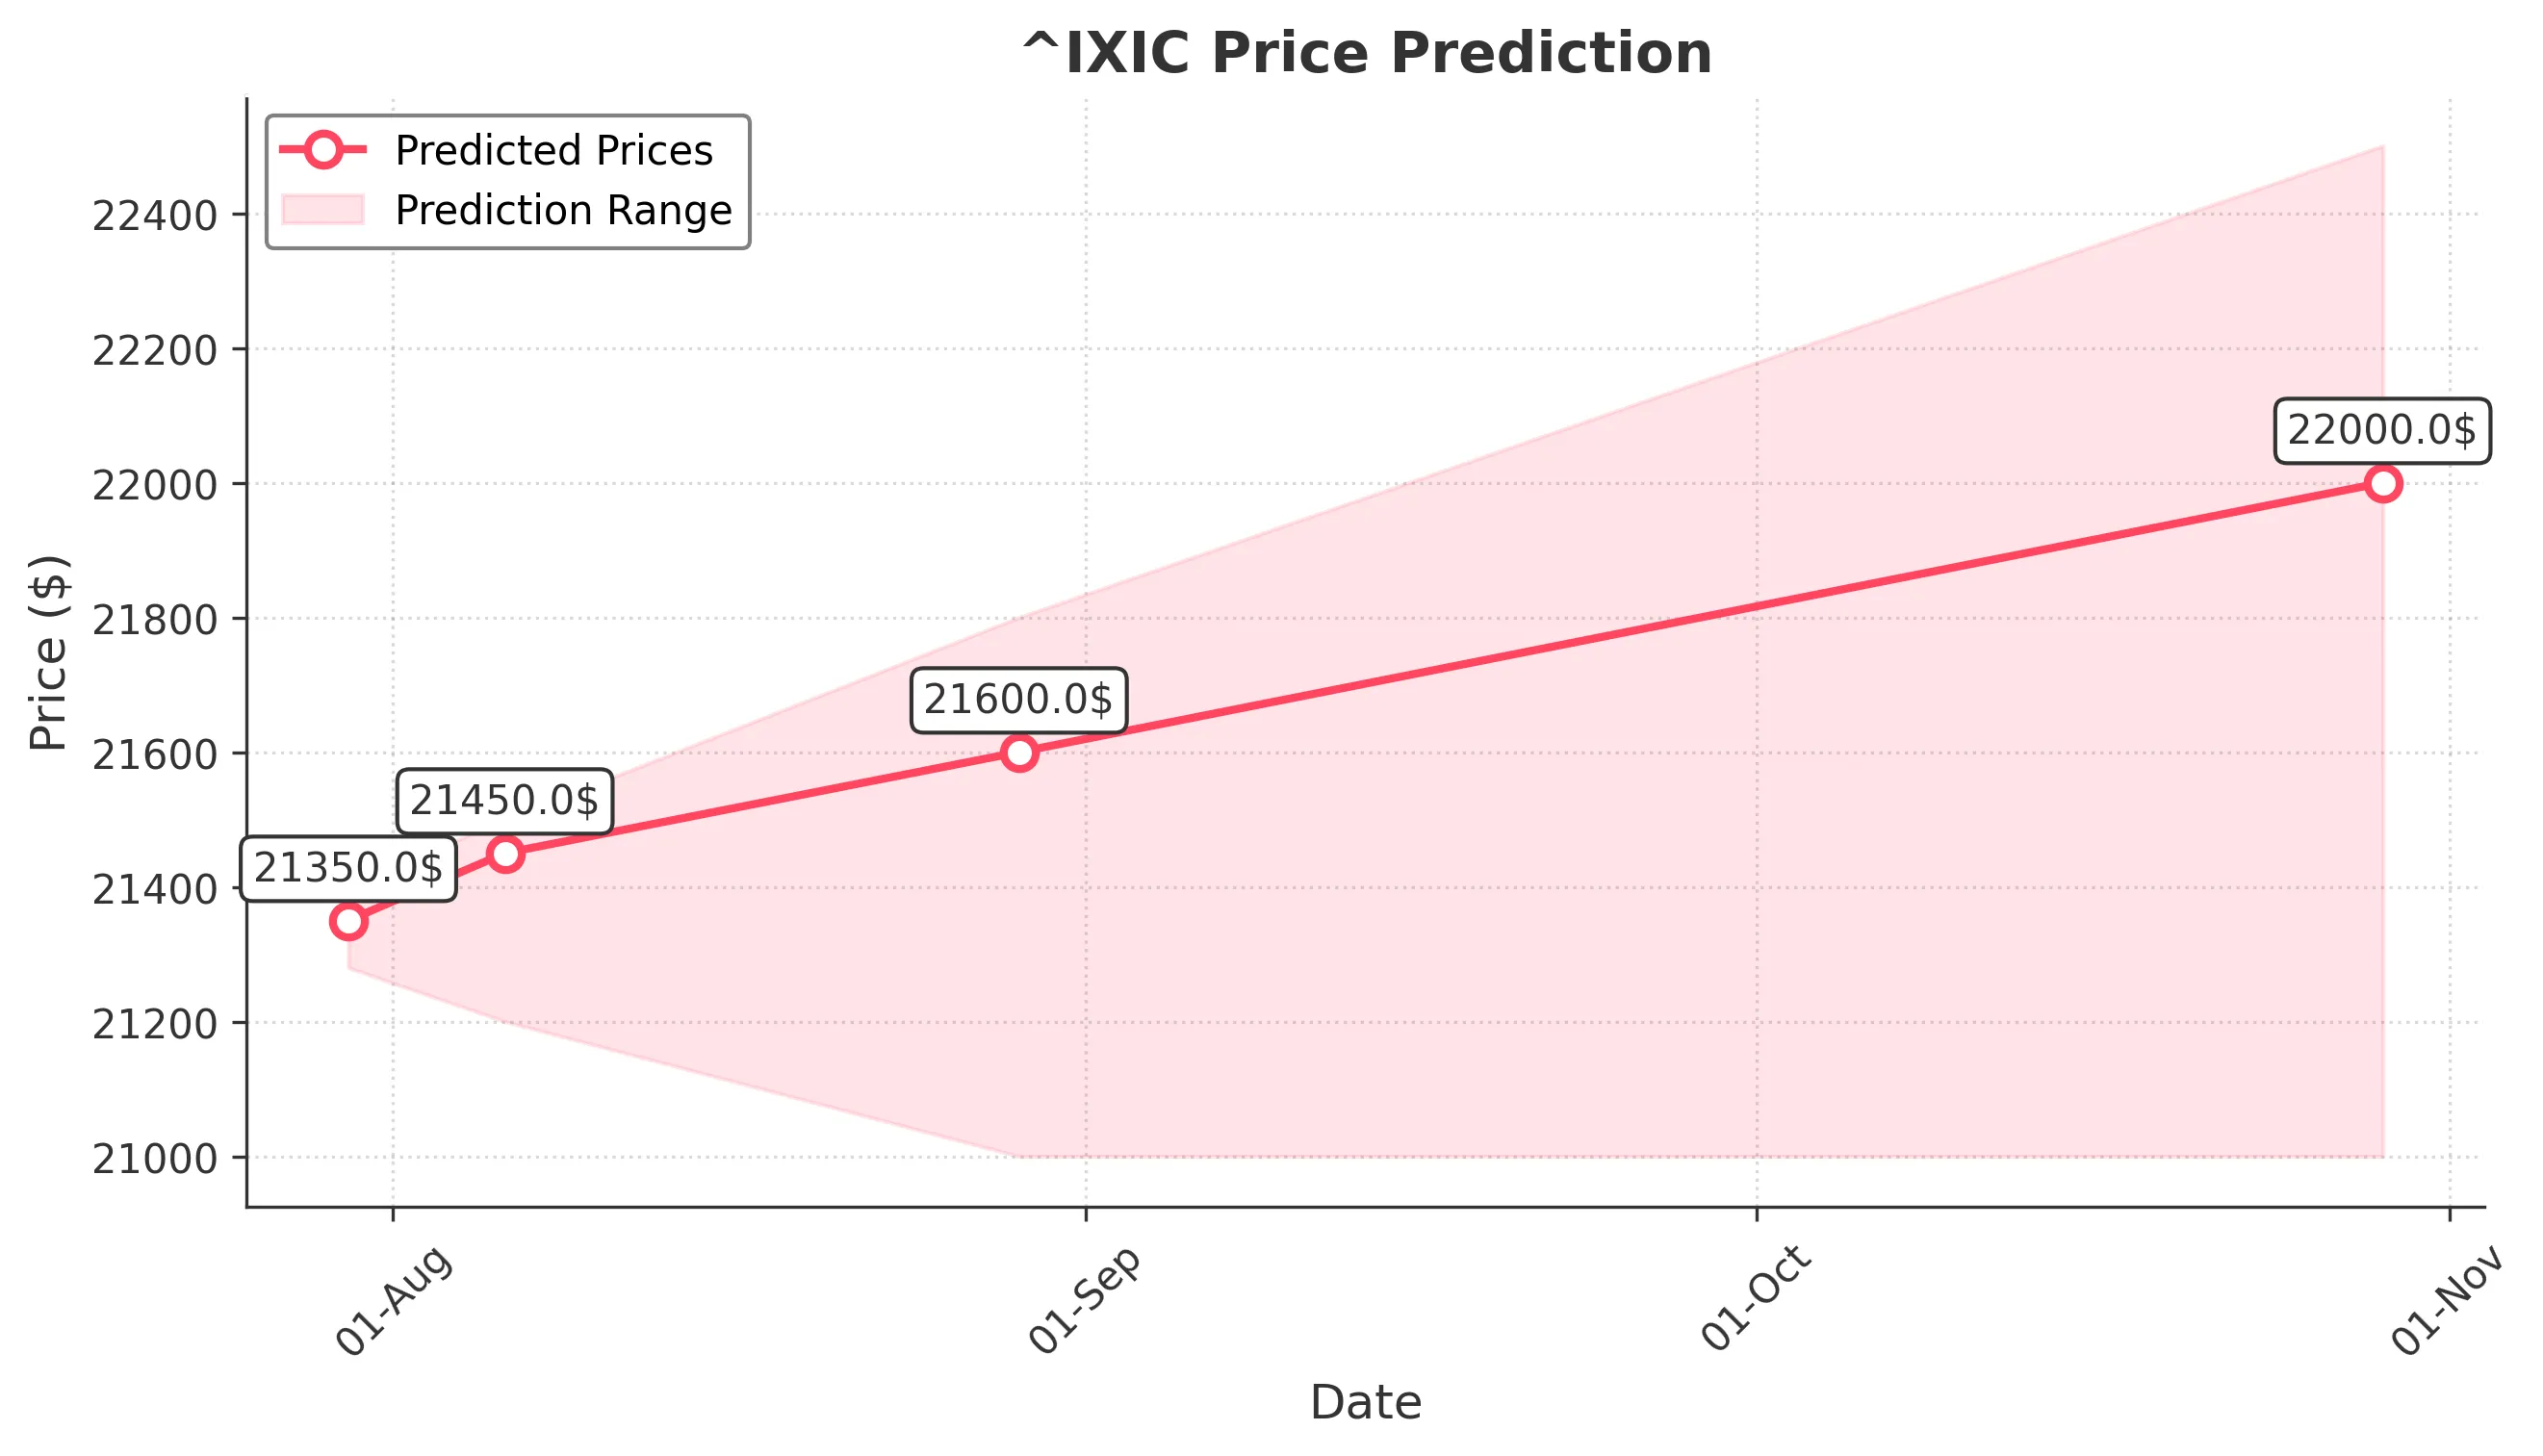
Target: July 30, 2025$21350
$21310
$21400
$21280
Description
The market shows bullish momentum with a recent upward trend. The RSI is approaching overbought levels, indicating potential for a pullback. However, strong volume suggests continued interest. Expect a slight increase in price.
Analysis
The past 3 months show a bullish trend with significant support at 21000. The MACD indicates upward momentum, while Bollinger Bands suggest volatility. Volume spikes on up days indicate strong buying interest.
Confidence Level
Potential Risks
Potential for a pullback if RSI exceeds overbought levels. Market sentiment could shift due to external news.
1 Week Prediction
Target: August 6, 2025$21450
$21380
$21500
$21200
Description
The bullish trend is expected to continue, supported by strong volume and positive market sentiment. However, the RSI indicates potential overbought conditions, which could lead to volatility.
Analysis
The stock has shown consistent upward movement, with key resistance at 21500. The MACD remains positive, and volume analysis indicates strong buying pressure. However, caution is warranted as the market approaches overbought territory.
Confidence Level
Potential Risks
Market corrections are possible if external factors influence sentiment negatively. Watch for any bearish candlestick patterns.
1 Month Prediction
Target: August 29, 2025$21600
$21500
$21800
$21000
Description
Expect continued bullish momentum, but with increased volatility as the market may face resistance at higher levels. The Fibonacci retracement levels suggest potential pullbacks.
Analysis
The stock has been in a strong uptrend, with significant support at 21000. The ATR indicates increasing volatility, and the RSI is nearing overbought levels. Volume patterns suggest sustained interest, but caution is advised.
Confidence Level
Potential Risks
Economic data releases and geopolitical events could impact market sentiment. Watch for signs of reversal.
3 Months Prediction
Target: October 29, 2025$22000
$21900
$22500
$21000
Description
Long-term bullish outlook supported by strong fundamentals and market sentiment. However, potential corrections may occur as the market approaches resistance levels.
Analysis
The overall trend remains bullish, with key resistance at 22500. The MACD is positive, but the RSI indicates potential overbought conditions. Volume analysis shows strong buying interest, but external factors could introduce volatility.
Confidence Level
Potential Risks
Unforeseen macroeconomic events could lead to volatility. Watch for changes in market sentiment and economic indicators.