NSDQ Trading Predictions
1 Day Prediction
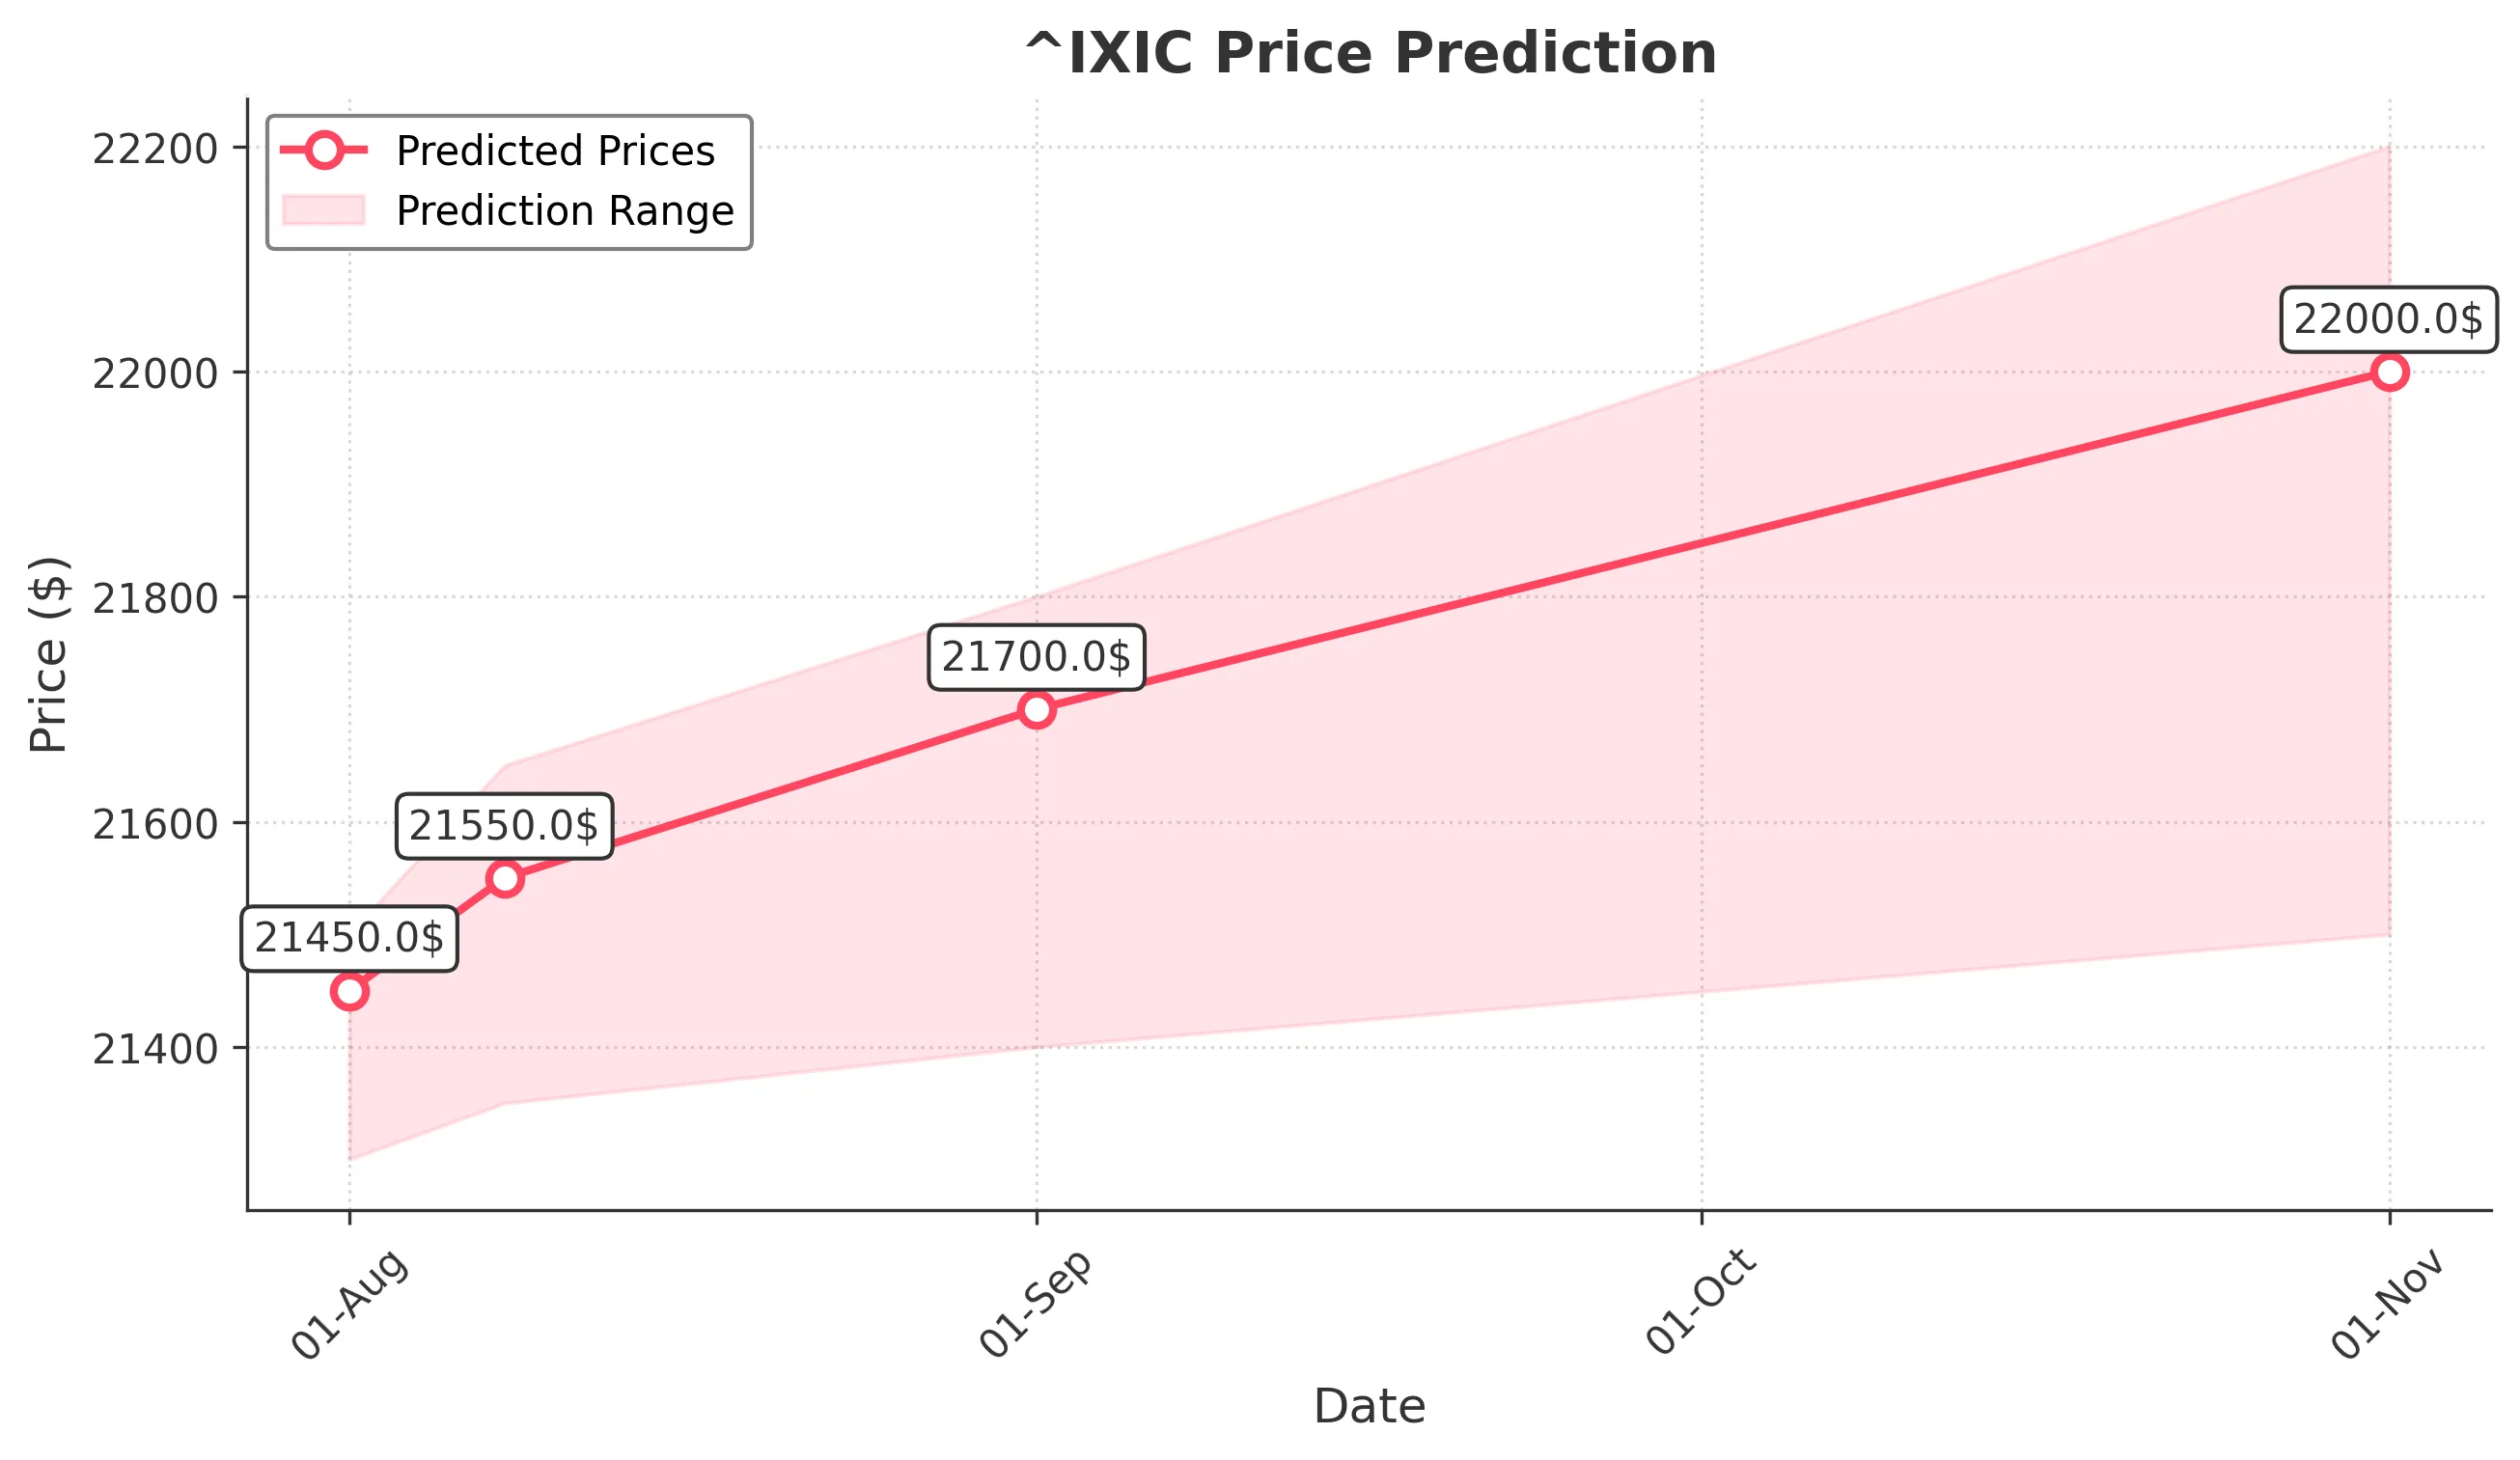
Target: August 1, 2025$21450
$21400
$21500
$21300
Description
The market shows bullish momentum with a recent upward trend. The RSI is nearing overbought levels, indicating potential for a pullback. However, strong volume suggests continued interest. Expect a close around 21450.
Analysis
The past 3 months show a bullish trend with significant support at 21000. The MACD is positive, and the recent candlestick patterns indicate strength. Volume spikes on up days suggest strong buying interest.
Confidence Level
Potential Risks
Potential for a pullback due to overbought RSI and market sentiment shifts.
1 Week Prediction
Target: August 8, 2025$21550
$21480
$21650
$21350
Description
The bullish trend is expected to continue, supported by strong volume and positive market sentiment. However, the RSI indicates potential overbought conditions, which could lead to volatility.
Analysis
The stock has shown consistent upward movement, with resistance at 21600. The MACD remains bullish, and volume patterns indicate strong buying. However, caution is warranted due to potential overbought conditions.
Confidence Level
Potential Risks
Market corrections could occur if profit-taking happens, especially with high RSI levels.
1 Month Prediction
Target: September 1, 2025$21700
$21550
$21800
$21400
Description
Expect continued bullish momentum, with potential for new highs. The market sentiment remains positive, but watch for signs of exhaustion as the RSI approaches overbought territory.
Analysis
The stock has been in a strong uptrend, with key support at 21500. The MACD is bullish, and volume remains robust. However, the RSI indicates potential overbought conditions, suggesting a need for caution.
Confidence Level
Potential Risks
Market corrections or external economic factors could impact the bullish trend.
3 Months Prediction
Target: November 1, 2025$22000
$21800
$22200
$21500
Description
Long-term bullish outlook as the market continues to show strength. However, potential economic headwinds could create volatility. Watch for key support levels around 21500.
Analysis
The overall trend remains bullish, with significant resistance at 22000. The MACD is positive, but the RSI indicates potential overbought conditions. Volume patterns suggest strong interest, but external factors could introduce volatility.
Confidence Level
Potential Risks
Economic indicators and geopolitical events could significantly impact market direction.