NSDQ Trading Predictions
1 Day Prediction
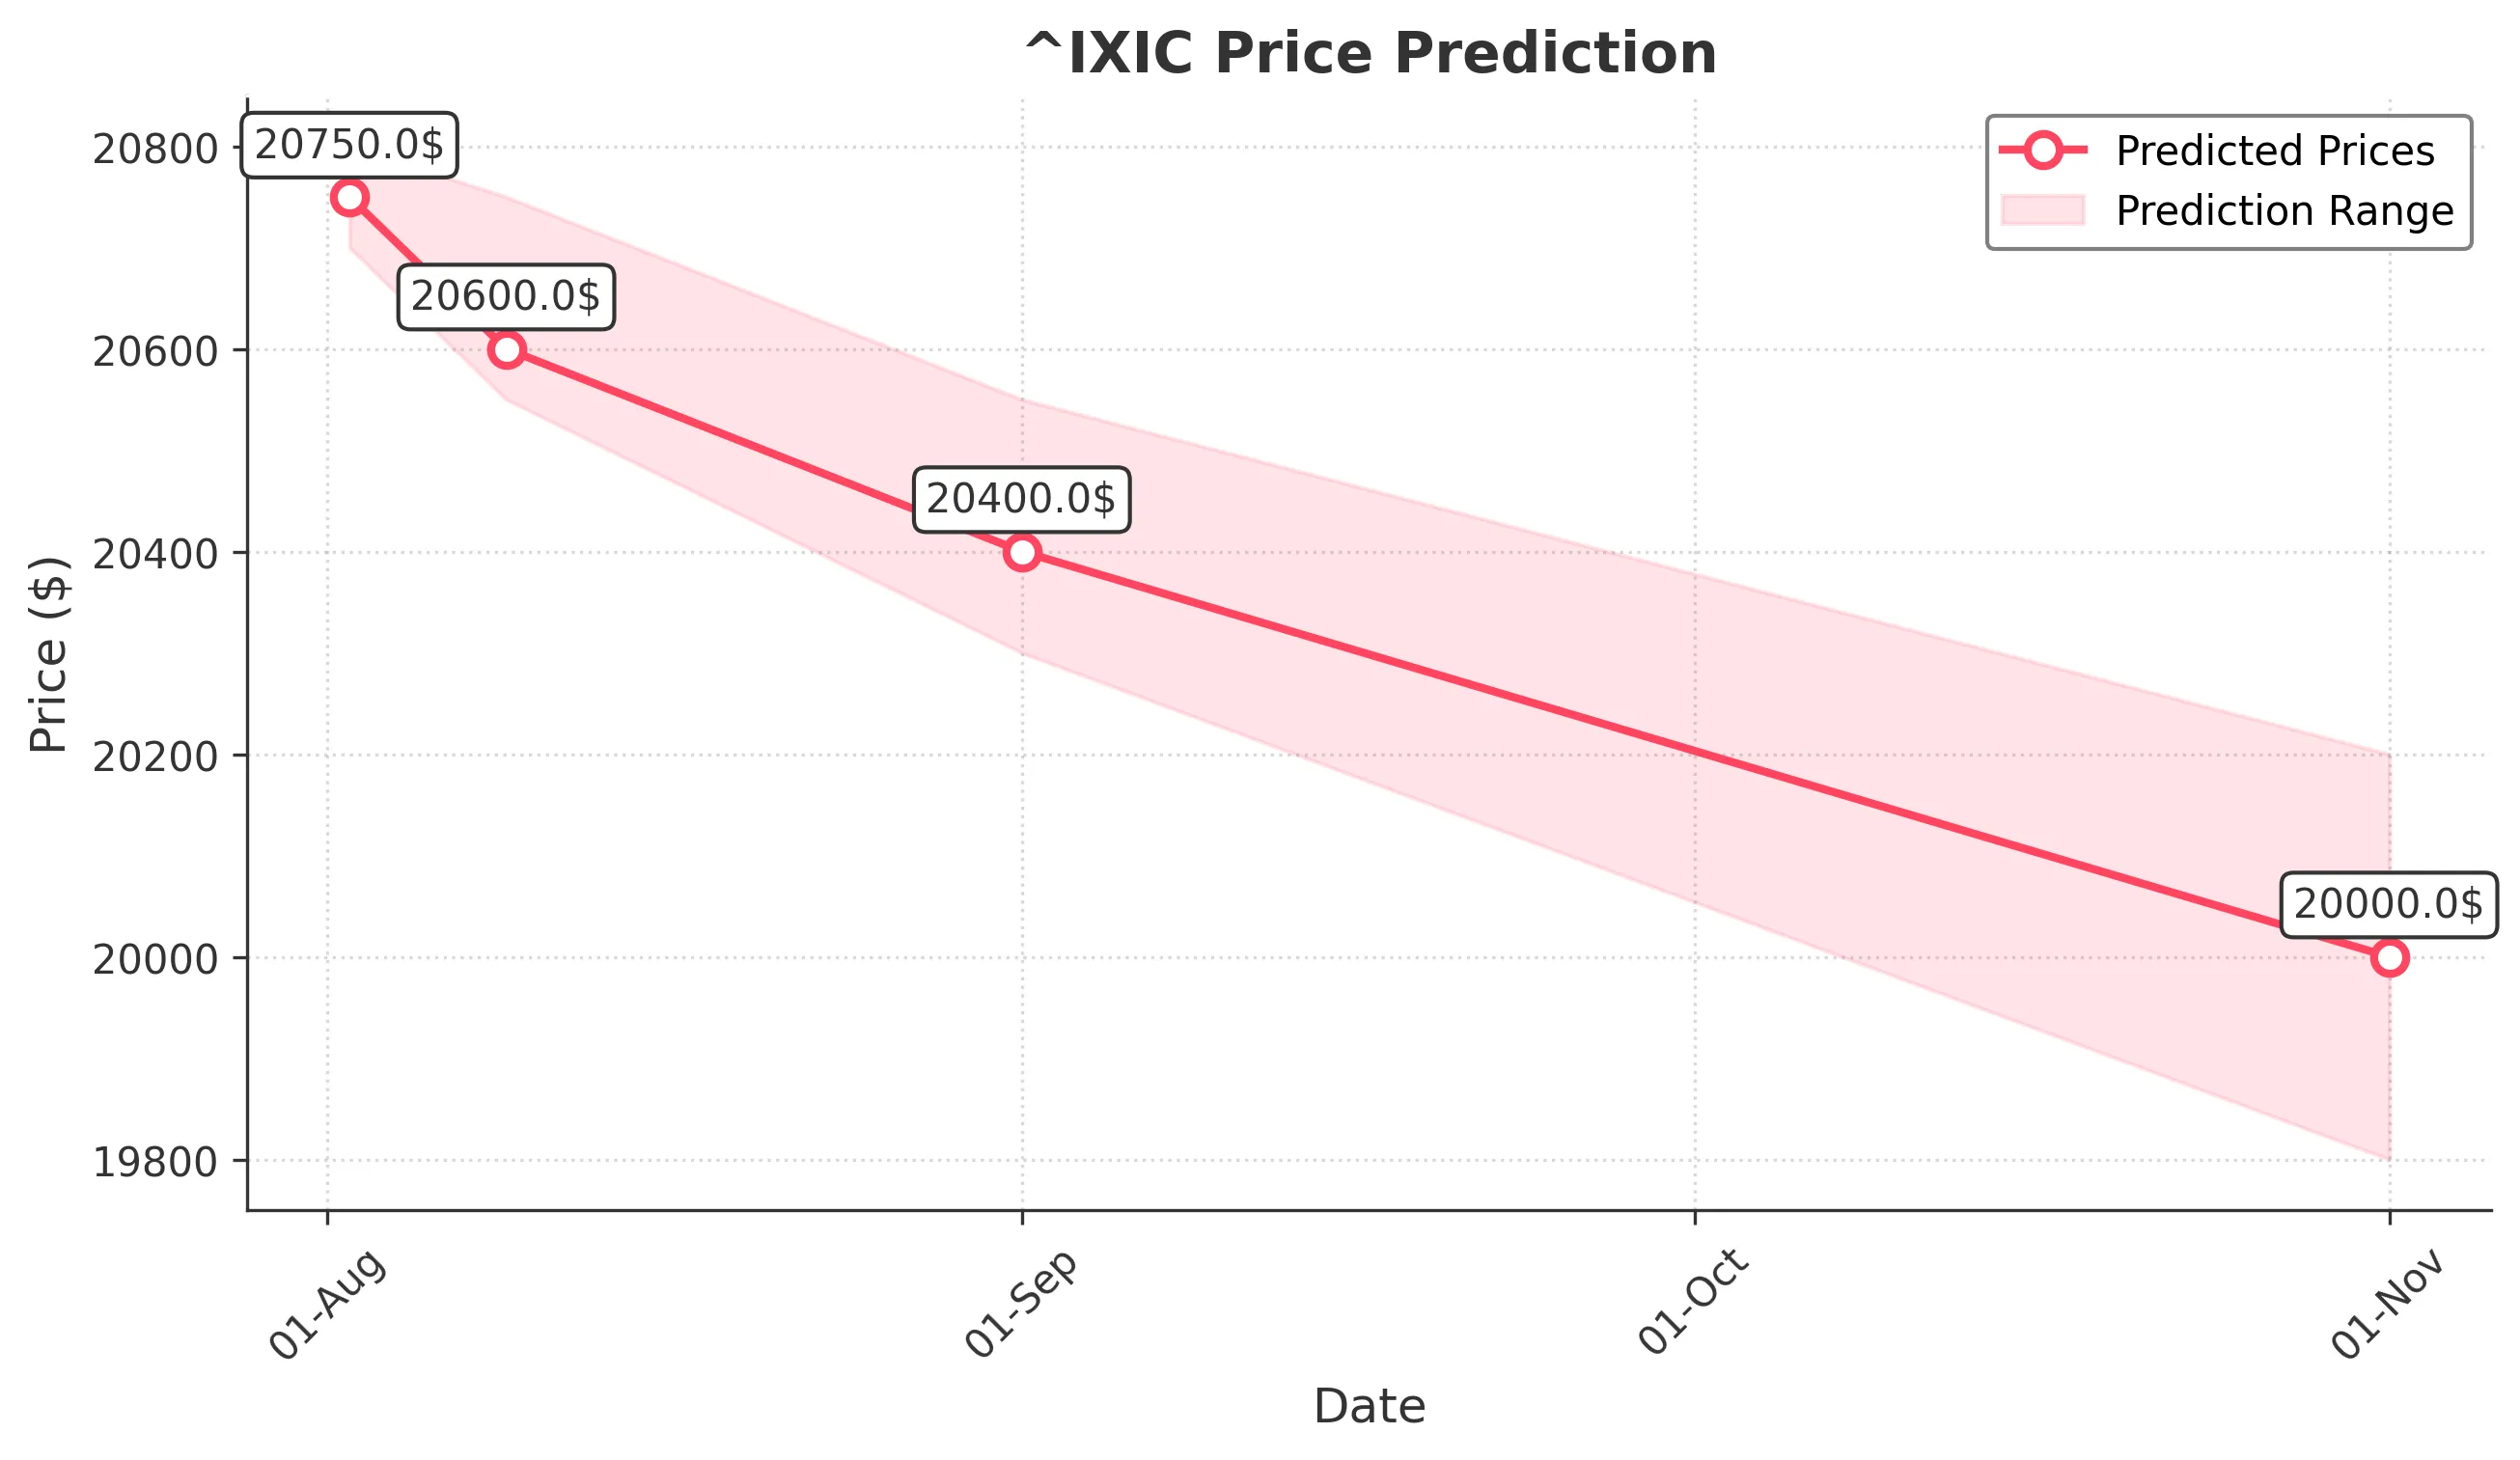
Target: August 2, 2025$20750
$20780
$20800
$20700
Description
The market shows signs of bearish sentiment after a significant drop. RSI indicates oversold conditions, while MACD shows a bearish crossover. Expect a slight recovery but overall weakness due to recent selling pressure.
Analysis
The past 3 months show a bullish trend with significant highs, but recent price action indicates a bearish reversal. Key support at 20700 and resistance at 21000. Volume spikes suggest profit-taking, and macroeconomic factors may influence sentiment.
Confidence Level
Potential Risks
Market volatility and potential news could impact the prediction. A reversal is possible if bullish sentiment returns.
1 Week Prediction
Target: August 9, 2025$20600
$20700
$20750
$20550
Description
Bearish momentum is expected to continue as the market reacts to recent highs. The Bollinger Bands indicate potential for further downside, and the ATR suggests increased volatility. Watch for support at 20550.
Analysis
The stock has shown a strong upward trend but is now facing resistance. Recent candlestick patterns indicate indecision, and volume analysis shows a decline in buying interest. Key support at 20550 may hold, but bearish sentiment is prevalent.
Confidence Level
Potential Risks
Unforeseen macroeconomic events or earnings reports could lead to unexpected price movements.
1 Month Prediction
Target: September 1, 2025$20400
$20550
$20550
$20300
Description
Continued bearish pressure is anticipated as the market adjusts to recent highs. The RSI remains in a bearish zone, and MACD indicates a sustained downtrend. Expect further testing of support levels.
Analysis
The stock has experienced a significant pullback after reaching new highs. Key support levels are being tested, and the overall trend appears to be shifting bearish. Volume patterns suggest a lack of conviction among buyers.
Confidence Level
Potential Risks
Market sentiment can shift rapidly, and external factors may lead to unexpected bullish reversals.
3 Months Prediction
Target: November 1, 2025$20000
$20100
$20200
$19800
Description
A bearish outlook is projected as the market continues to face headwinds. The Fibonacci retracement levels suggest a potential drop towards 20000, with significant resistance at 20500. Watch for macroeconomic developments.
Analysis
The stock has shown volatility with a recent bearish trend. Key support at 20000 is critical, and if broken, further declines may occur. The overall market sentiment is cautious, with macroeconomic factors influencing investor behavior.
Confidence Level
Potential Risks
Long-term predictions are uncertain due to potential market recovery or external economic factors.