NSDQ Trading Predictions
1 Day Prediction
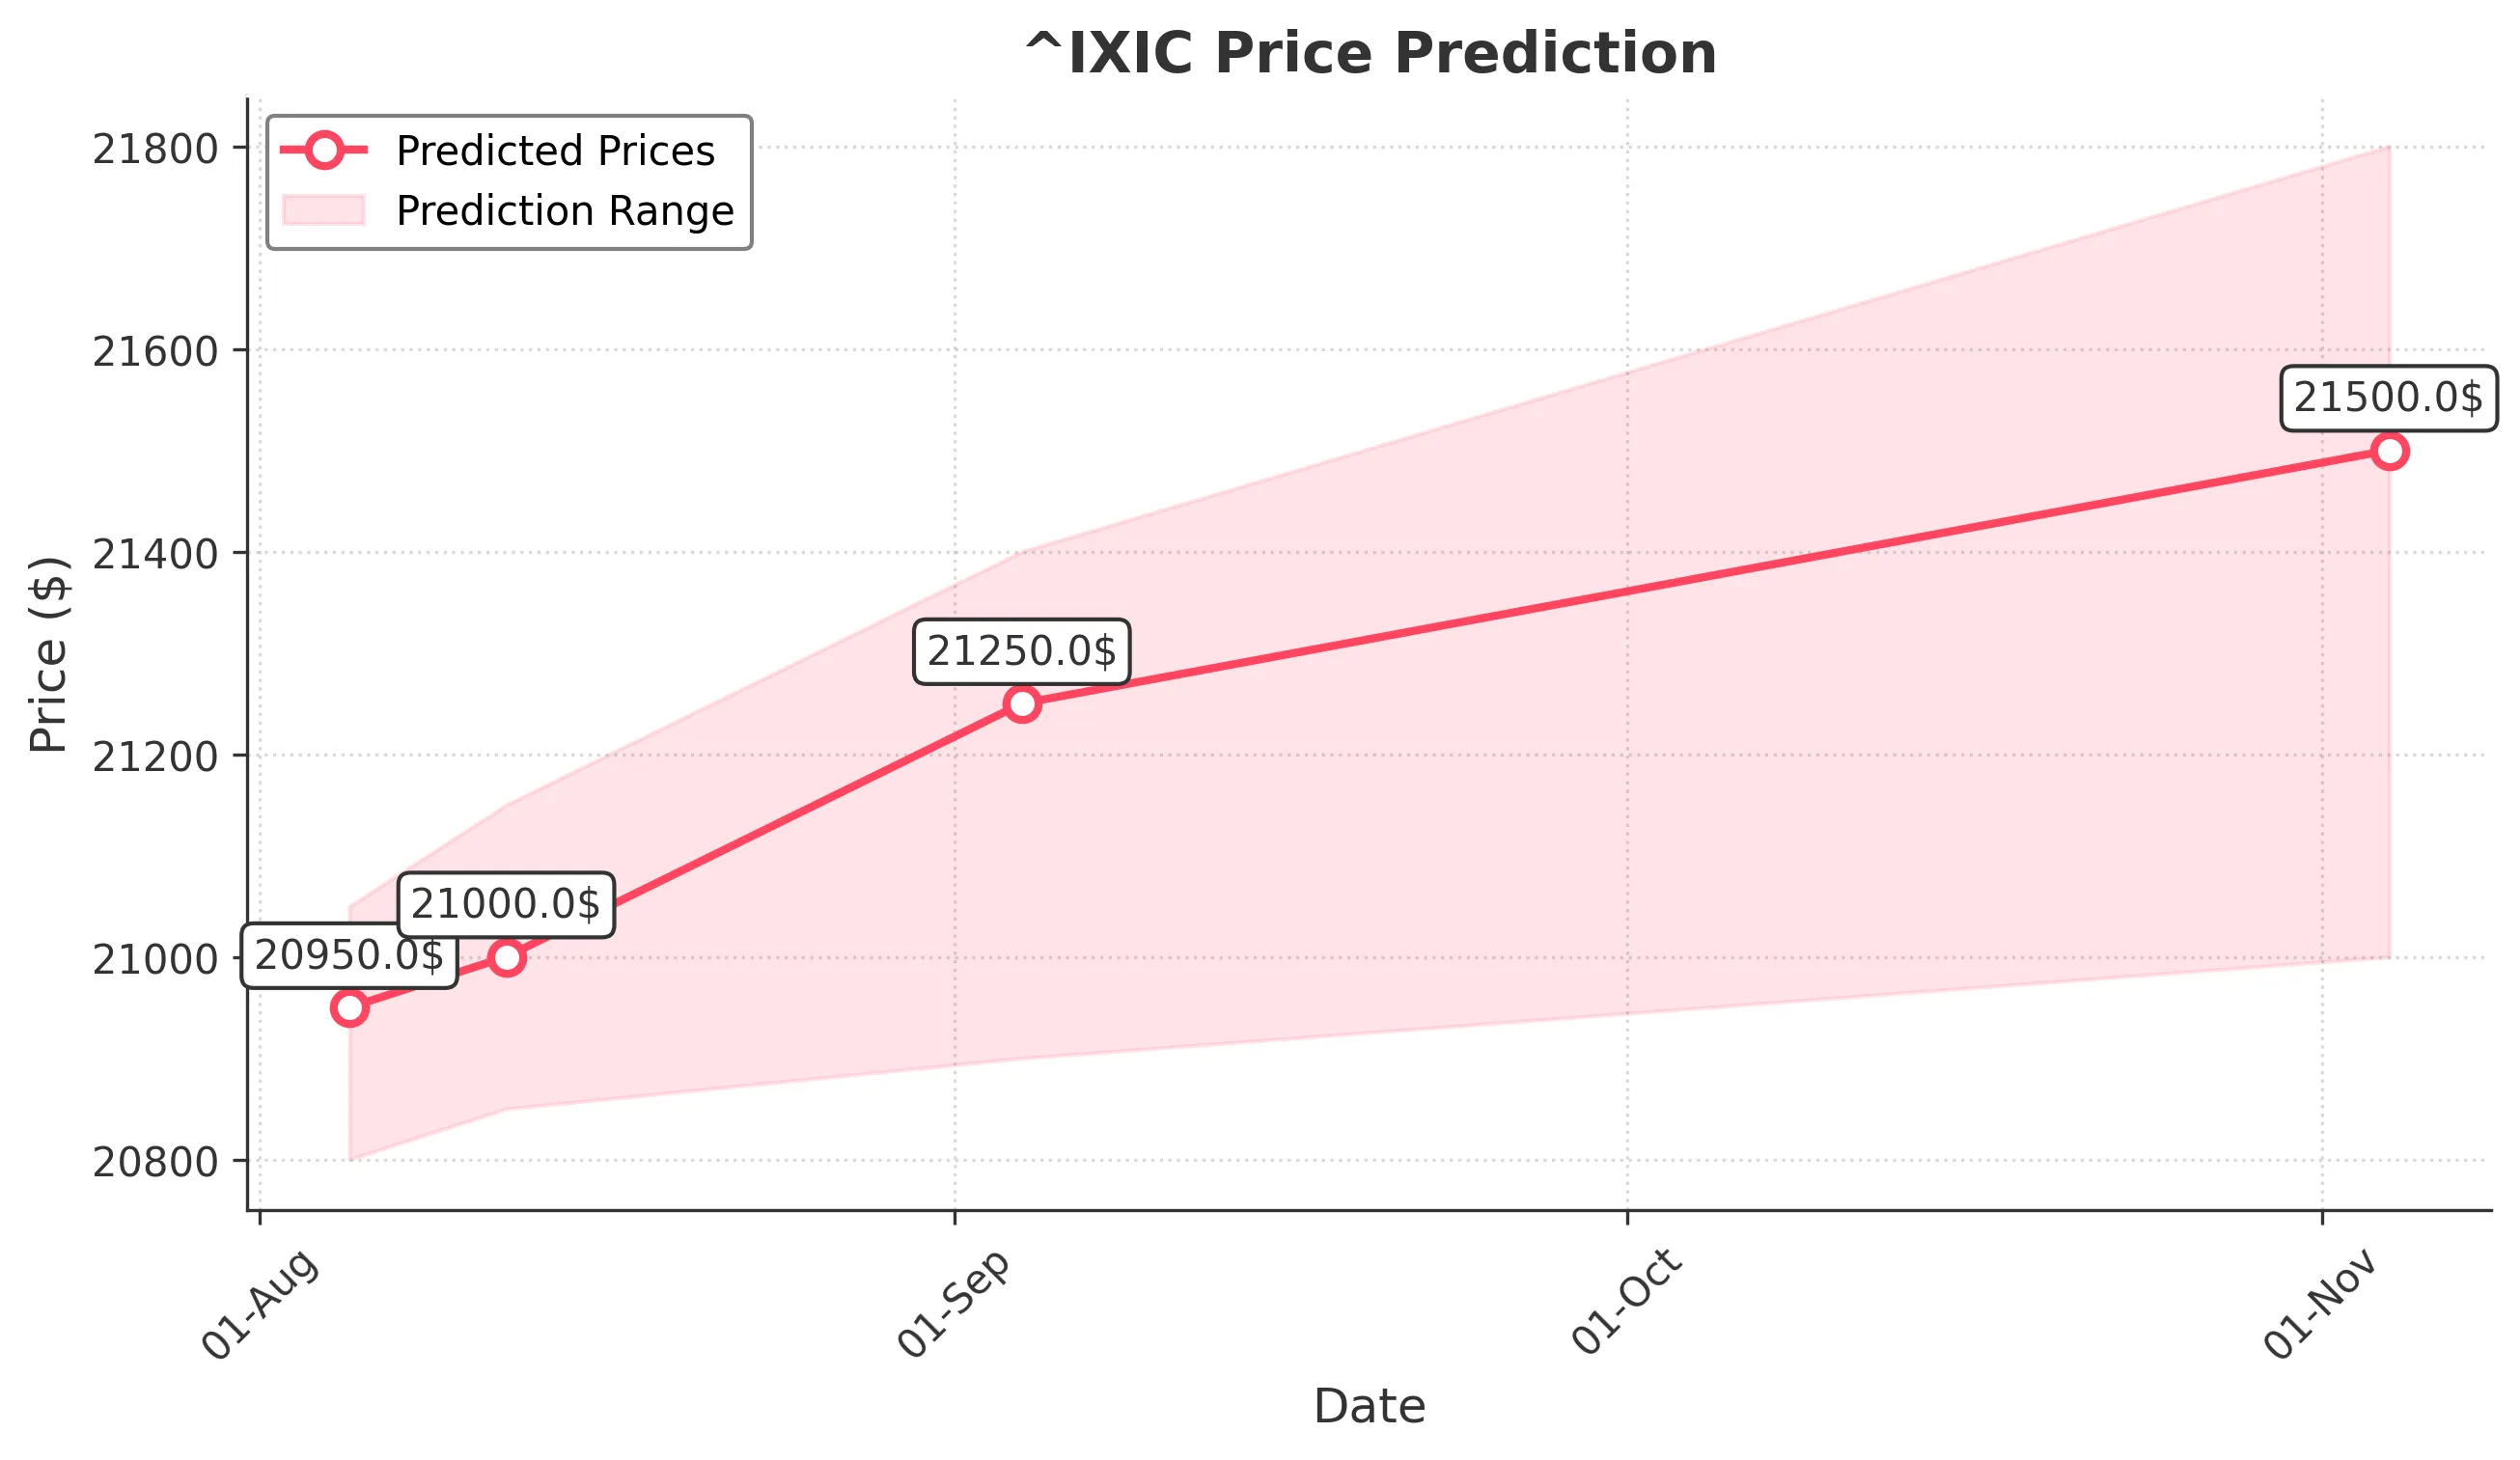
Target: August 5, 2025$20950
$20900
$21050
$20800
Description
The market shows a slight bullish trend with a recent Doji candlestick indicating indecision. RSI is neutral, and MACD is showing a potential bullish crossover. Expect a close around 20950 as traders react to recent earnings reports.
Analysis
The past 3 months show a bullish trend with significant support at 20650 and resistance at 21100. Volume has been increasing, indicating strong interest. However, recent fluctuations suggest caution as the market may be overbought.
Confidence Level
Potential Risks
Market volatility and external news could impact this prediction, especially if there are unexpected economic indicators.
1 Week Prediction
Target: August 12, 2025$21000
$20950
$21150
$20850
Description
With the current bullish momentum and a potential breakout above resistance levels, a close around 21000 is expected. The MACD remains positive, and the RSI is approaching overbought territory, indicating strong buying pressure.
Analysis
The stock has shown consistent upward movement, with key support at 20800. The recent increase in volume suggests strong buying interest. However, the RSI nearing overbought levels raises concerns about a possible pullback.
Confidence Level
Potential Risks
Potential market corrections or geopolitical events could lead to sudden price changes.
1 Month Prediction
Target: September 4, 2025$21250
$21050
$21400
$20900
Description
The bullish trend is expected to continue, with a target close of 21250. Fibonacci retracement levels support this upward movement, and the MACD remains bullish. However, watch for potential resistance at 21400.
Analysis
The stock has been in a strong uptrend, with significant support at 20900. The MACD and RSI indicate bullish momentum, but the market's reaction to upcoming economic indicators could influence price direction.
Confidence Level
Potential Risks
Economic data releases and earnings reports could introduce volatility, impacting the forecast.
3 Months Prediction
Target: November 4, 2025$21500
$21300
$21800
$21000
Description
Expect a close around 21500 as the market continues its bullish trend. The MACD remains strong, and the RSI is stabilizing. However, potential economic downturns could pose risks to this forecast.
Analysis
The stock has shown resilience with a bullish trend, but the potential for market corrections exists. Key support is at 21000, while resistance is at 21800. The overall sentiment remains positive, but caution is advised.
Confidence Level
Potential Risks
Unforeseen macroeconomic events or shifts in market sentiment could lead to price corrections.