NSDQ Trading Predictions
1 Day Prediction
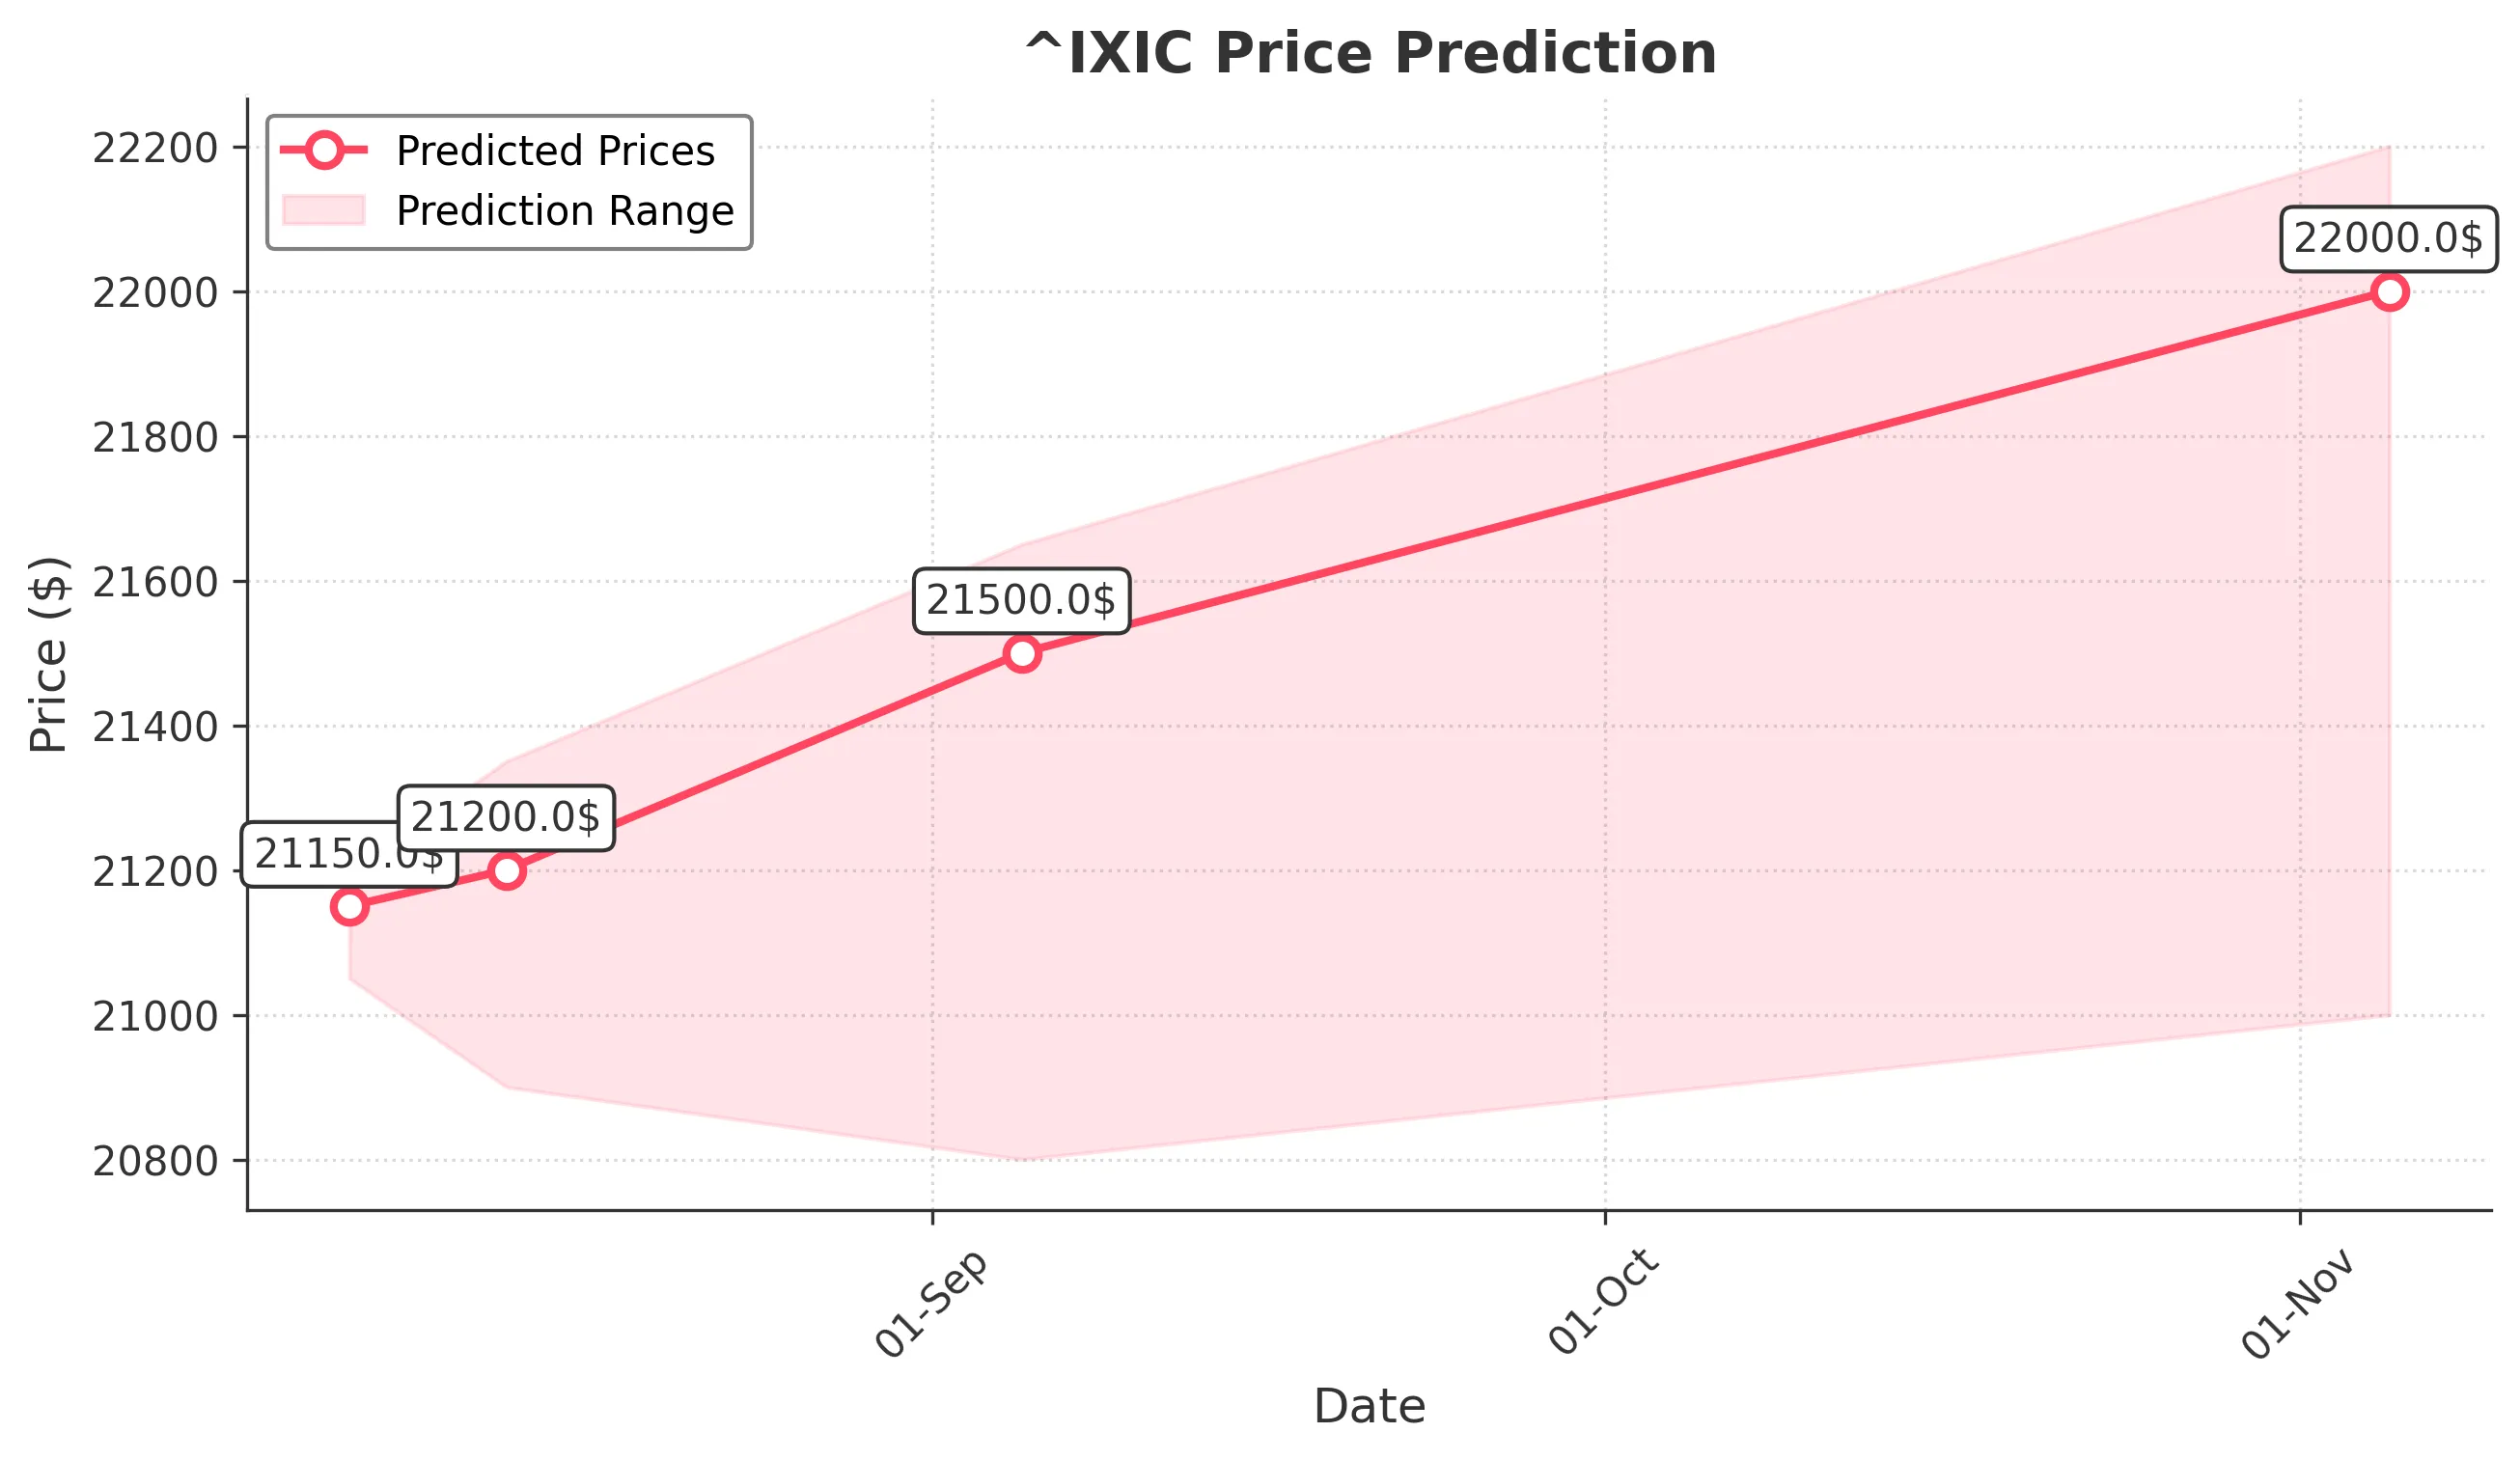
Target: August 6, 2025$21150
$21100
$21200
$21050
Description
The market shows bullish momentum with a recent upward trend. The RSI is approaching overbought levels, indicating potential for a pullback. However, strong volume suggests continued interest. Expect a slight increase in price.
Analysis
The past 3 months show a bullish trend with significant support at 20650. Recent price action indicates strong buying interest, but the RSI nearing overbought levels suggests caution. Volume spikes on upward days indicate strong momentum.
Confidence Level
Potential Risks
Potential for a reversal exists if market sentiment shifts or if macroeconomic news impacts investor confidence.
1 Week Prediction
Target: August 13, 2025$21200
$21150
$21350
$20900
Description
The bullish trend is expected to continue, supported by recent price action and volume. However, the market may face resistance around 21350. Watch for potential pullbacks as the RSI indicates overbought conditions.
Analysis
The stock has shown consistent upward movement, with key resistance at 21350. The MACD is bullish, but the RSI suggests caution. Volume remains strong, indicating sustained interest, but watch for signs of exhaustion.
Confidence Level
Potential Risks
Market volatility and external economic factors could lead to unexpected price movements, especially if earnings reports or economic data are released.
1 Month Prediction
Target: September 5, 2025$21500
$21250
$21650
$20800
Description
Expect continued bullish momentum, with potential for new highs. The market sentiment remains positive, but overbought conditions may lead to corrections. Key resistance at 21650 could limit upside.
Analysis
The stock has been in a strong uptrend, with significant support at 21000. The Bollinger Bands indicate potential for price expansion, but the RSI suggests caution. Volume patterns indicate strong buying interest, but watch for signs of reversal.
Confidence Level
Potential Risks
Economic indicators and geopolitical events could impact market sentiment, leading to volatility. A correction could occur if profit-taking begins.
3 Months Prediction
Target: November 5, 2025$22000
$21500
$22200
$21000
Description
Long-term bullish outlook as the market continues to show strength. However, potential corrections may occur due to overbought conditions. Key resistance at 22200 could pose challenges.
Analysis
The overall trend remains bullish, with key support at 21000. The MACD indicates upward momentum, but the RSI suggests potential overbought conditions. Volume analysis shows strong interest, but external factors could introduce volatility.
Confidence Level
Potential Risks
Market dynamics can change rapidly due to economic data releases or geopolitical events. A significant downturn could occur if market sentiment shifts.