NSDQ Trading Predictions
1 Day Prediction
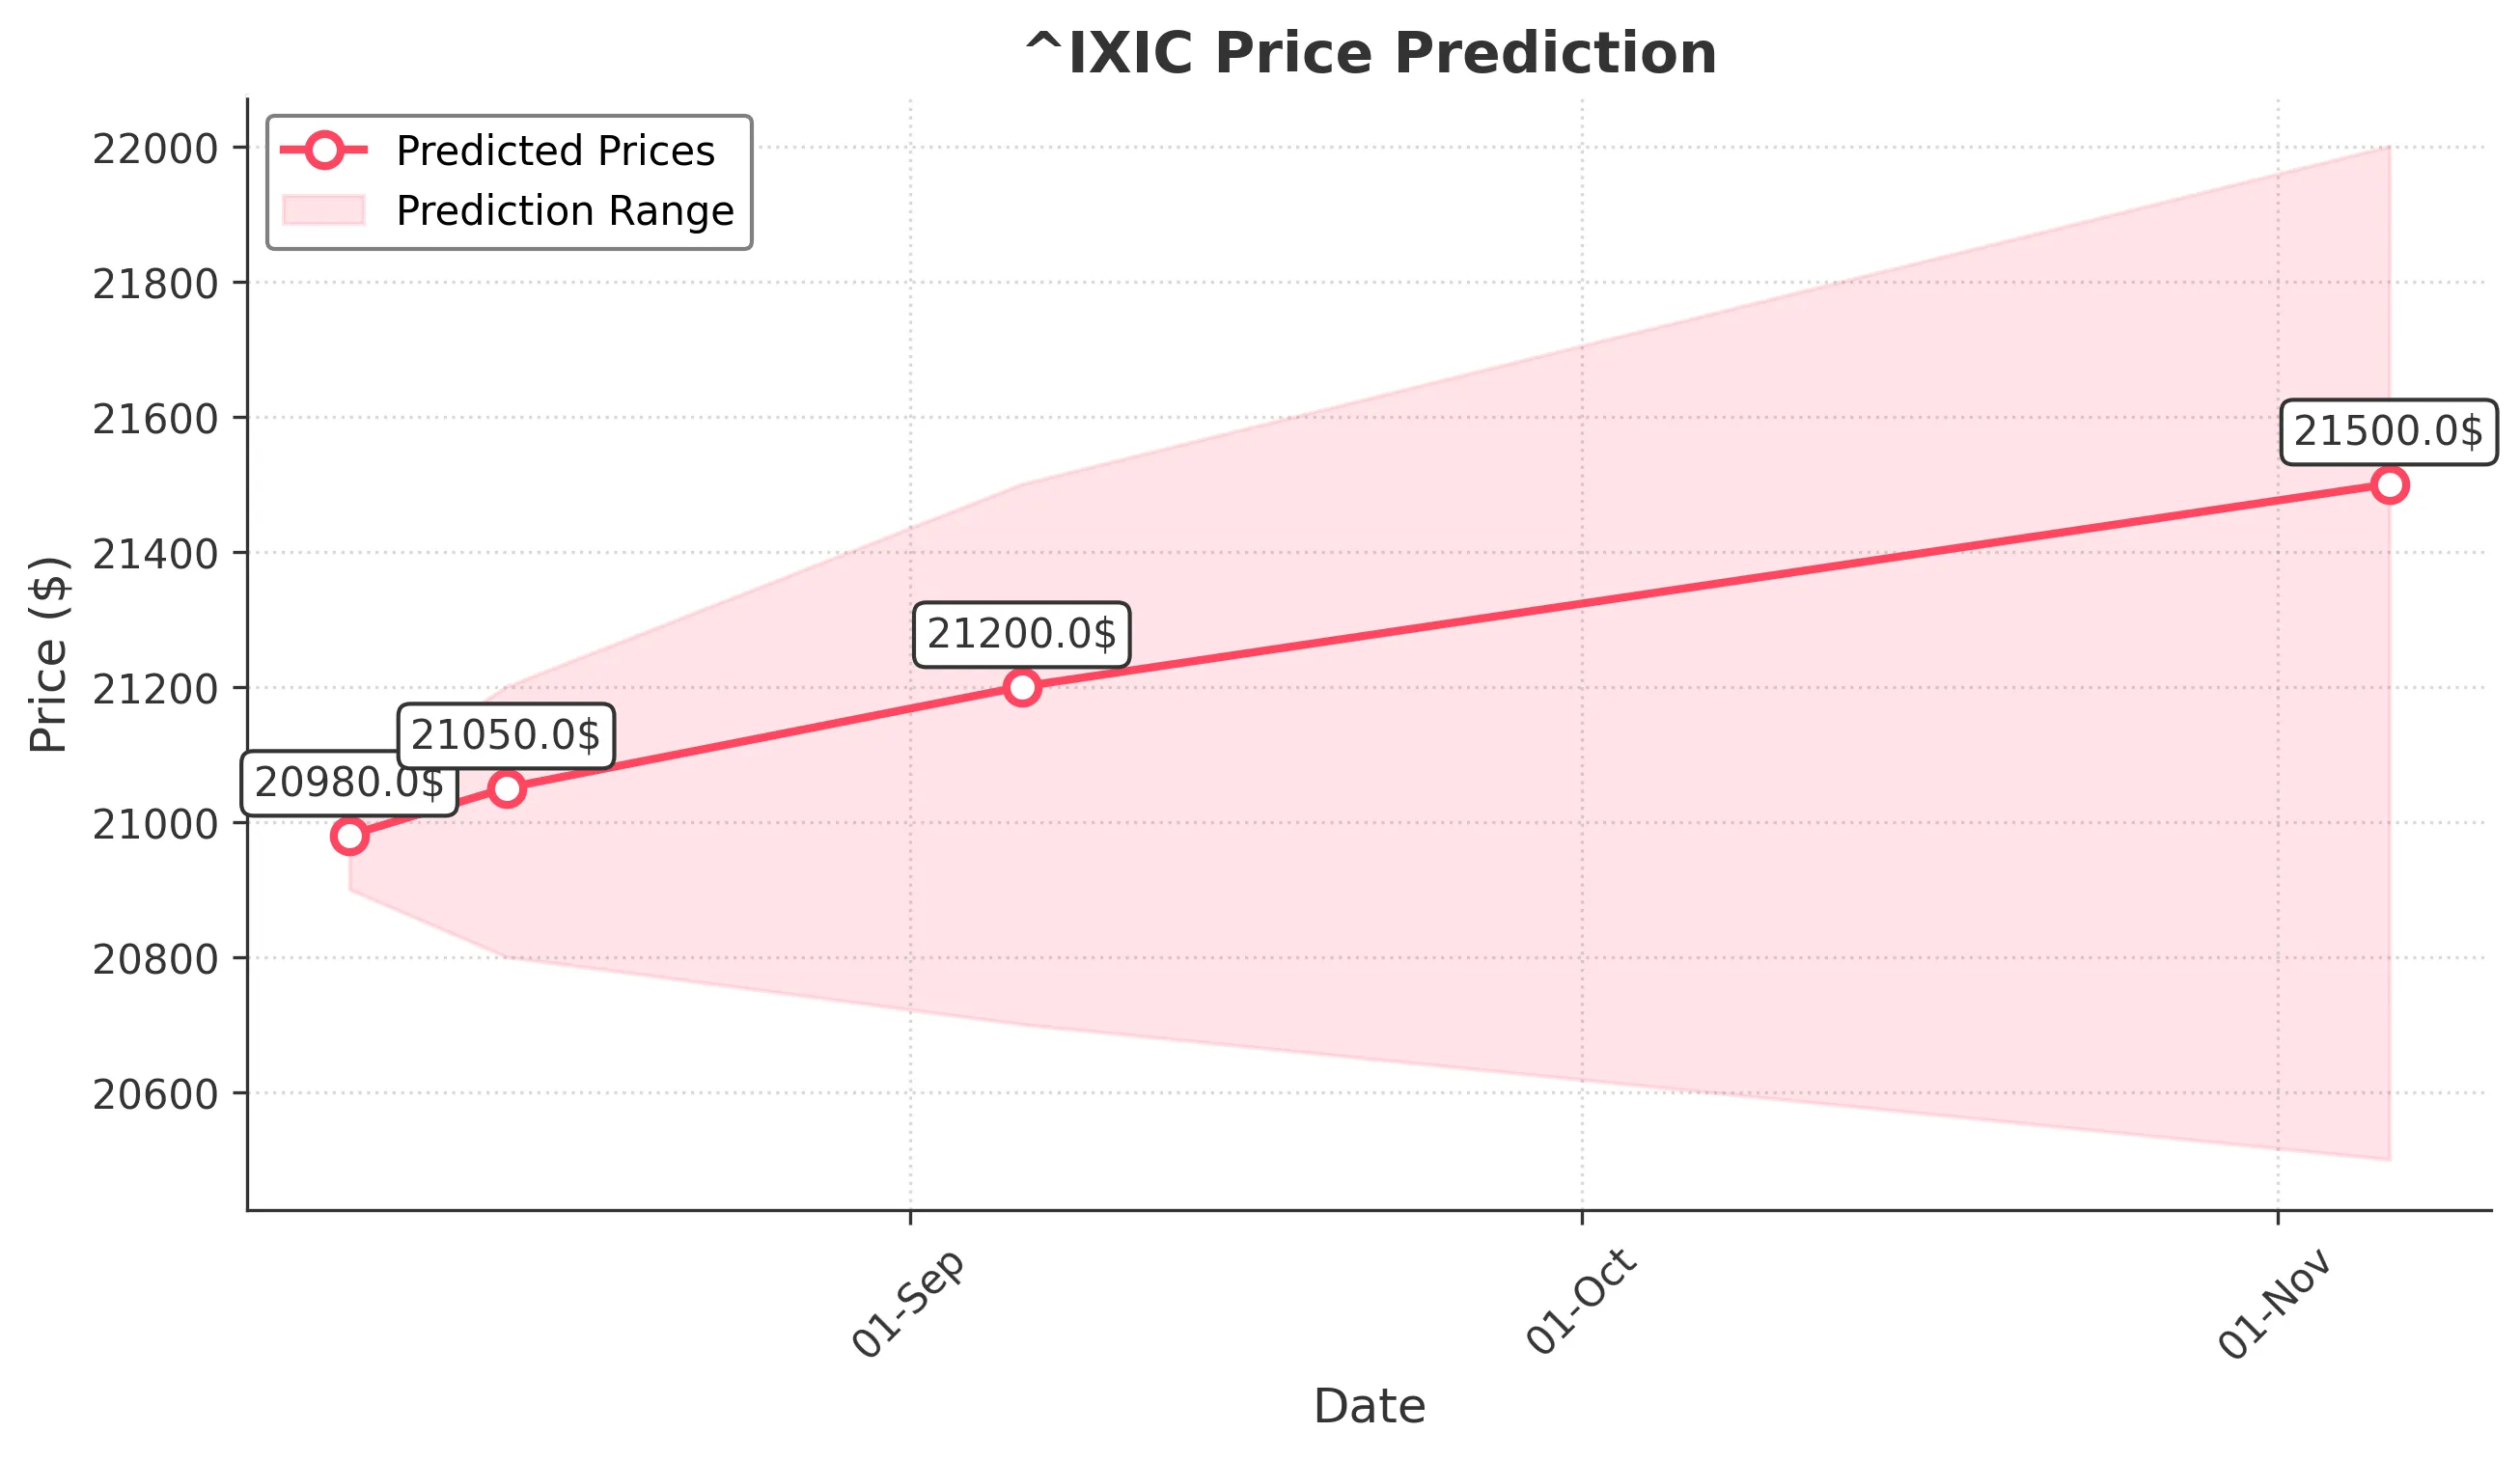
Target: August 7, 2025$20980
$20950
$21050
$20900
Description
The market shows a slight bullish trend with a recent Doji candlestick indicating indecision. RSI is near 60, suggesting potential upward momentum. However, MACD is flattening, indicating possible resistance ahead.
Analysis
Over the past 3 months, ^IXIC has shown a bullish trend with significant upward movements. Key support is around 20650, while resistance is near 21100. Volume spikes indicate strong buying interest, but recent candlestick patterns suggest caution.
Confidence Level
Potential Risks
Market volatility and external news could impact this prediction. A sudden downturn is possible if bearish sentiment prevails.
1 Week Prediction
Target: August 14, 2025$21050
$20980
$21200
$20800
Description
The bullish trend may continue, supported by a recent breakout above resistance levels. However, the RSI nearing overbought territory suggests a potential pullback. Watch for volume trends to confirm strength.
Analysis
The index has been trending upward, with significant resistance at 21100. Recent volume patterns indicate strong buying, but the market is susceptible to corrections. Technical indicators suggest caution as the RSI approaches overbought levels.
Confidence Level
Potential Risks
Potential market corrections and external economic factors could lead to unexpected price movements.
1 Month Prediction
Target: September 6, 2025$21200
$21050
$21500
$20700
Description
If the bullish momentum persists, we could see the index testing higher levels. However, the MACD divergence suggests potential weakness. A pullback to support levels is possible if market sentiment shifts.
Analysis
The past three months have shown a strong bullish trend, but recent volatility indicates potential for corrections. Key support at 20650 and resistance at 21100 are critical. The market's reaction to macroeconomic events will be pivotal.
Confidence Level
Potential Risks
Economic data releases and geopolitical events could significantly impact market direction.
3 Months Prediction
Target: November 6, 2025$21500
$21200
$22000
$20500
Description
Long-term bullish sentiment could drive prices higher, but potential economic headwinds may create volatility. Watch for key economic indicators that could influence market direction.
Analysis
The index has shown resilience with a bullish trend, but the potential for corrections exists. Key resistance levels are at 22000, while support is around 20500. The market's response to economic data will be crucial in determining future movements.
Confidence Level
Potential Risks
Unforeseen economic events or shifts in market sentiment could lead to significant price fluctuations.