NSDQ Trading Predictions
1 Day Prediction
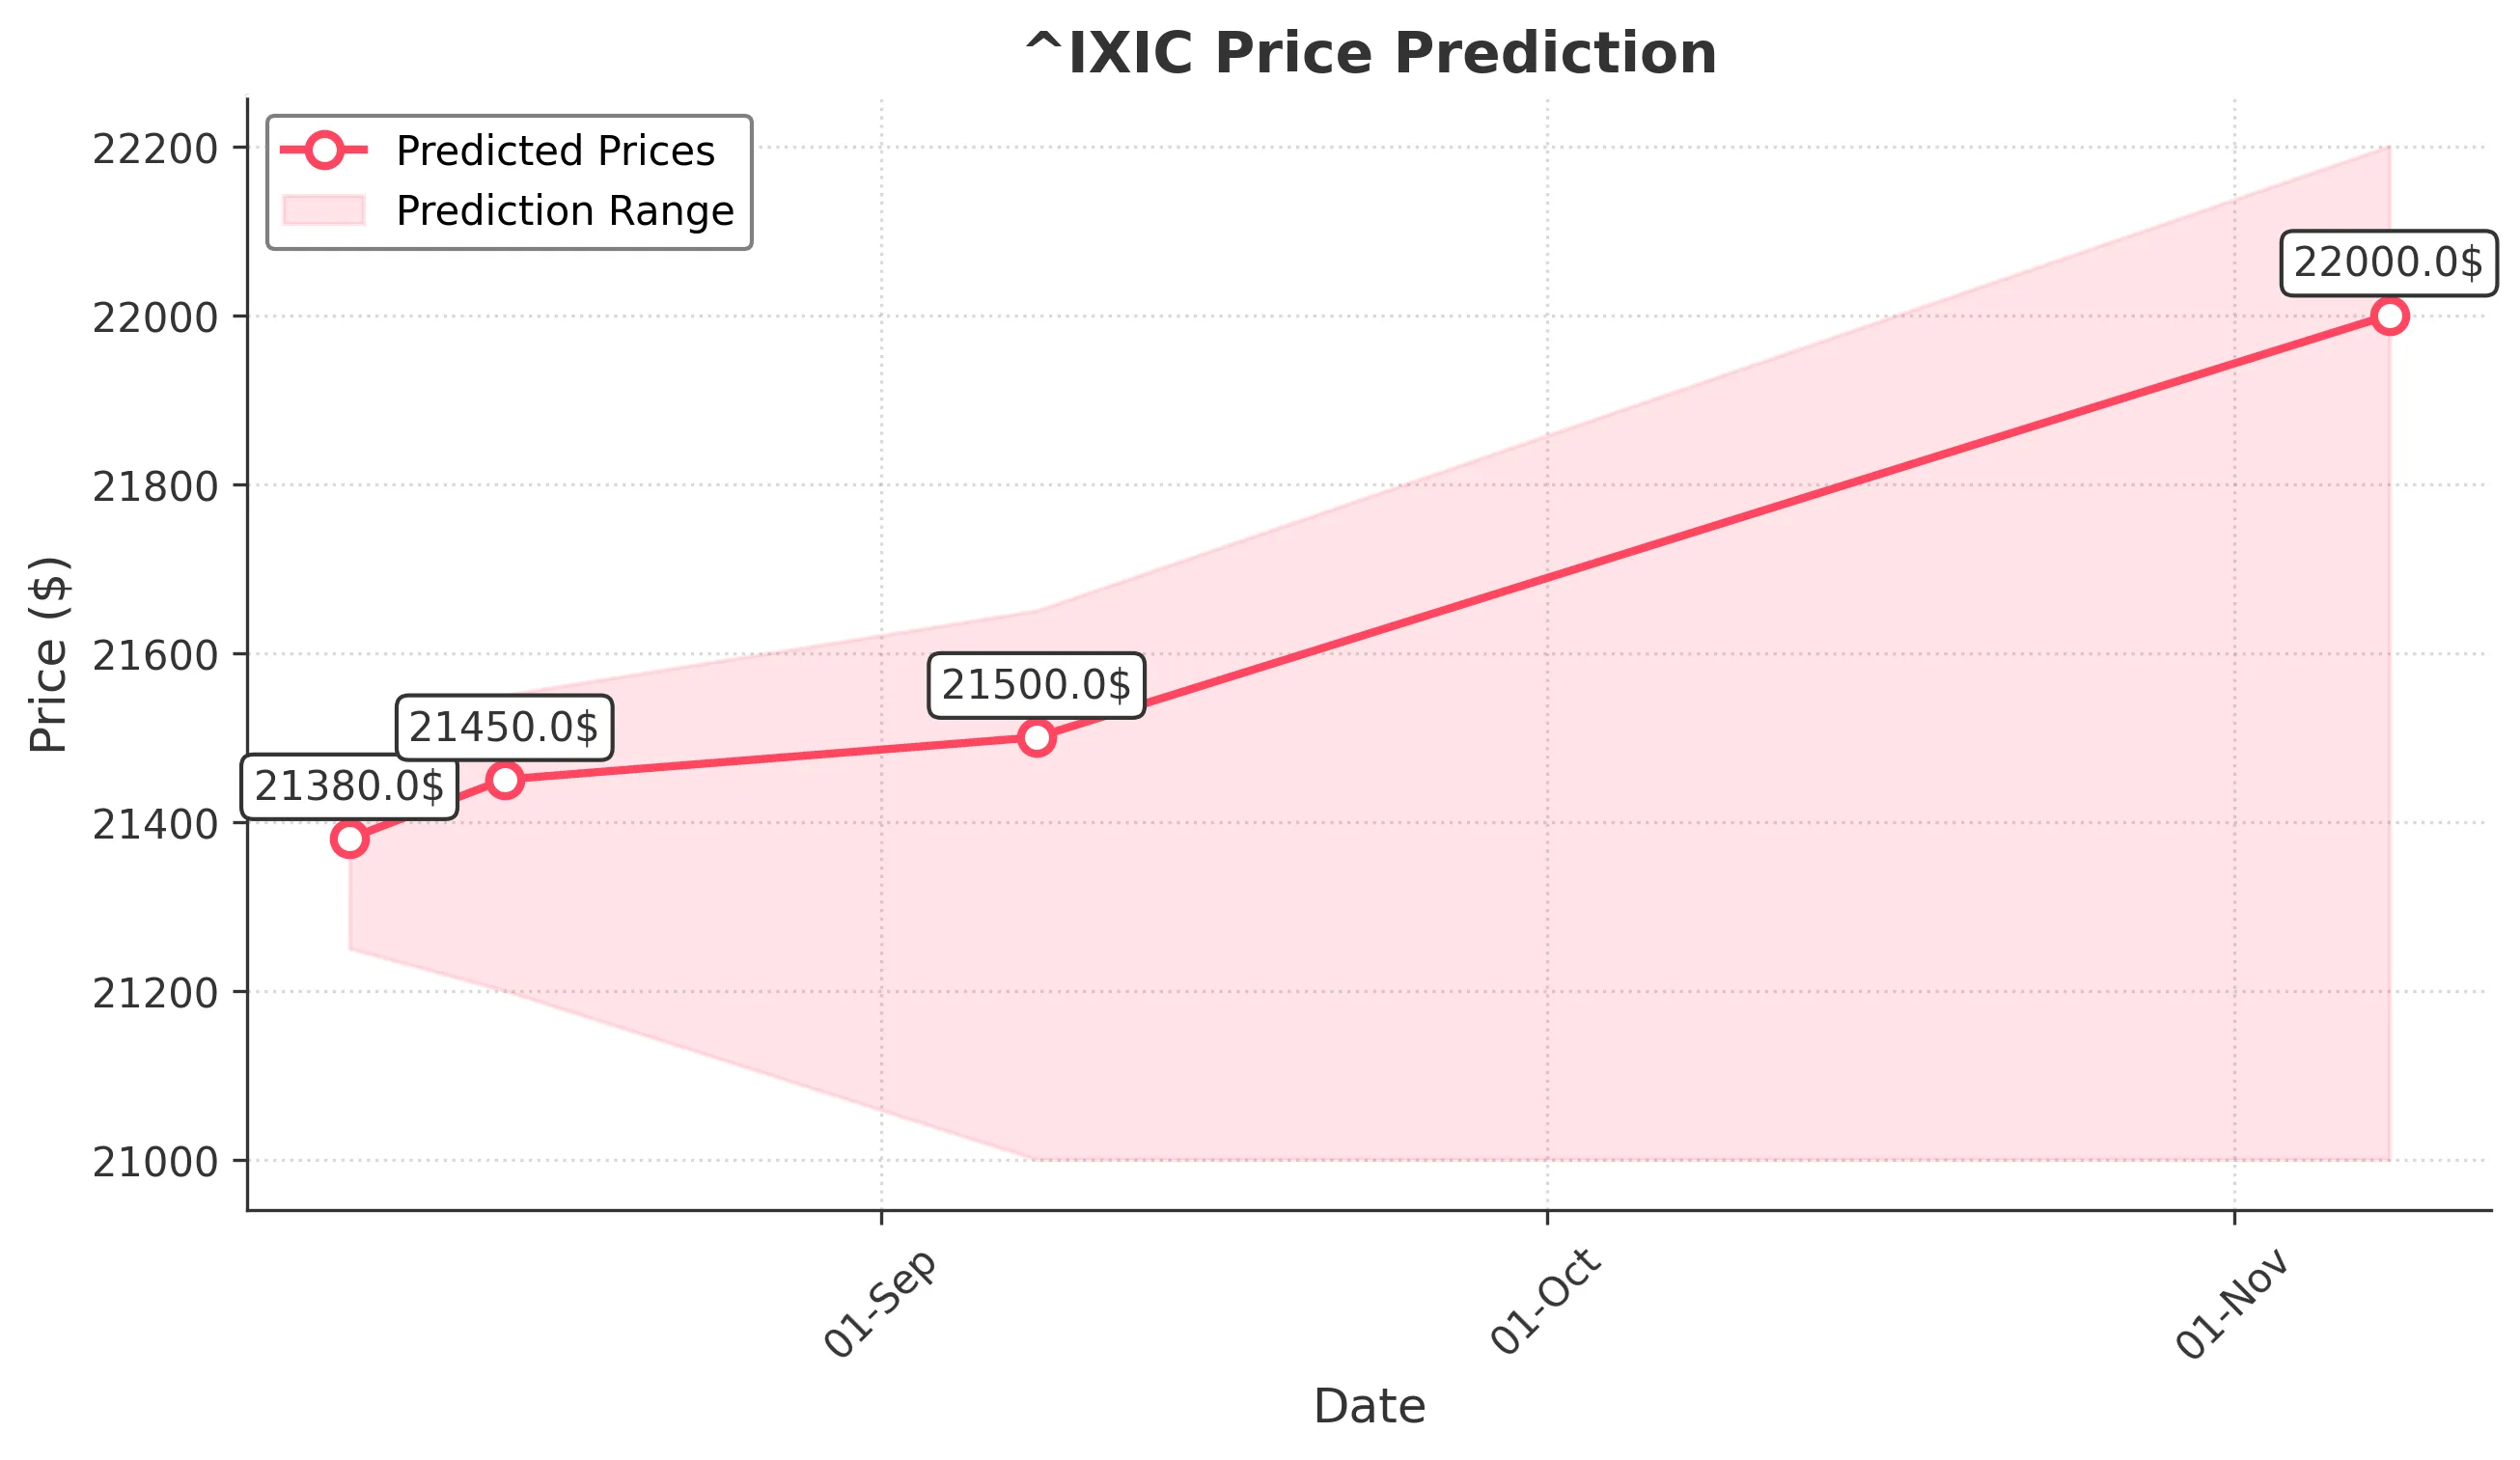
Target: August 8, 2025$21380
$21300
$21450
$21250
Description
The market shows bullish momentum with a recent upward trend. The RSI is approaching overbought levels, indicating potential for a pullback. However, strong support at 21250 suggests a bounce back. Volume remains robust, supporting the upward movement.
Analysis
Over the past 3 months, ^IXIC has shown a bullish trend, with significant support at 21000 and resistance around 21400. The MACD indicates upward momentum, while the ATR suggests moderate volatility. Recent volume spikes indicate strong buying interest, but caution is warranted as RSI nears overbought territory.
Confidence Level
Potential Risks
Potential for a reversal exists if market sentiment shifts or if macroeconomic news impacts investor confidence.
1 Week Prediction
Target: August 15, 2025$21450
$21380
$21550
$21200
Description
The bullish trend is expected to continue, with the market likely to test resistance at 21500. The MACD remains positive, and the recent candlestick patterns suggest continued buying pressure. However, watch for potential profit-taking.
Analysis
The index has maintained a strong upward trajectory, with key support at 21000. The Bollinger Bands indicate potential for a breakout, but the RSI suggests caution as it approaches overbought levels. Volume trends are positive, indicating sustained interest.
Confidence Level
Potential Risks
Market volatility could increase due to external economic factors or earnings reports, which may lead to unexpected price movements.
1 Month Prediction
Target: September 8, 2025$21500
$21400
$21650
$21000
Description
The market is expected to remain bullish, with a target of 21500. The Fibonacci retracement levels support this upward movement, but caution is advised as the RSI may indicate overbought conditions.
Analysis
The past three months have shown a strong bullish trend, with significant resistance at 21600. The MACD and moving averages support continued upward movement, but the market is at risk of a pullback if profit-taking occurs. Volume patterns suggest strong buying interest.
Confidence Level
Potential Risks
Economic data releases or geopolitical events could impact market sentiment, leading to increased volatility.
3 Months Prediction
Target: November 8, 2025$22000
$21800
$22200
$21000
Description
Long-term bullish sentiment is expected to drive prices higher, with potential to reach 22000. However, market corrections may occur, especially if economic indicators show weakness.
Analysis
The index has shown a strong upward trend, with key support at 21000 and resistance at 22200. The MACD indicates bullish momentum, but the market is susceptible to corrections. Volume analysis shows strong buying interest, but external factors could introduce volatility.
Confidence Level
Potential Risks
Unforeseen macroeconomic events or shifts in market sentiment could lead to significant volatility and impact the accuracy of this prediction.