NSDQ Trading Predictions
1 Day Prediction
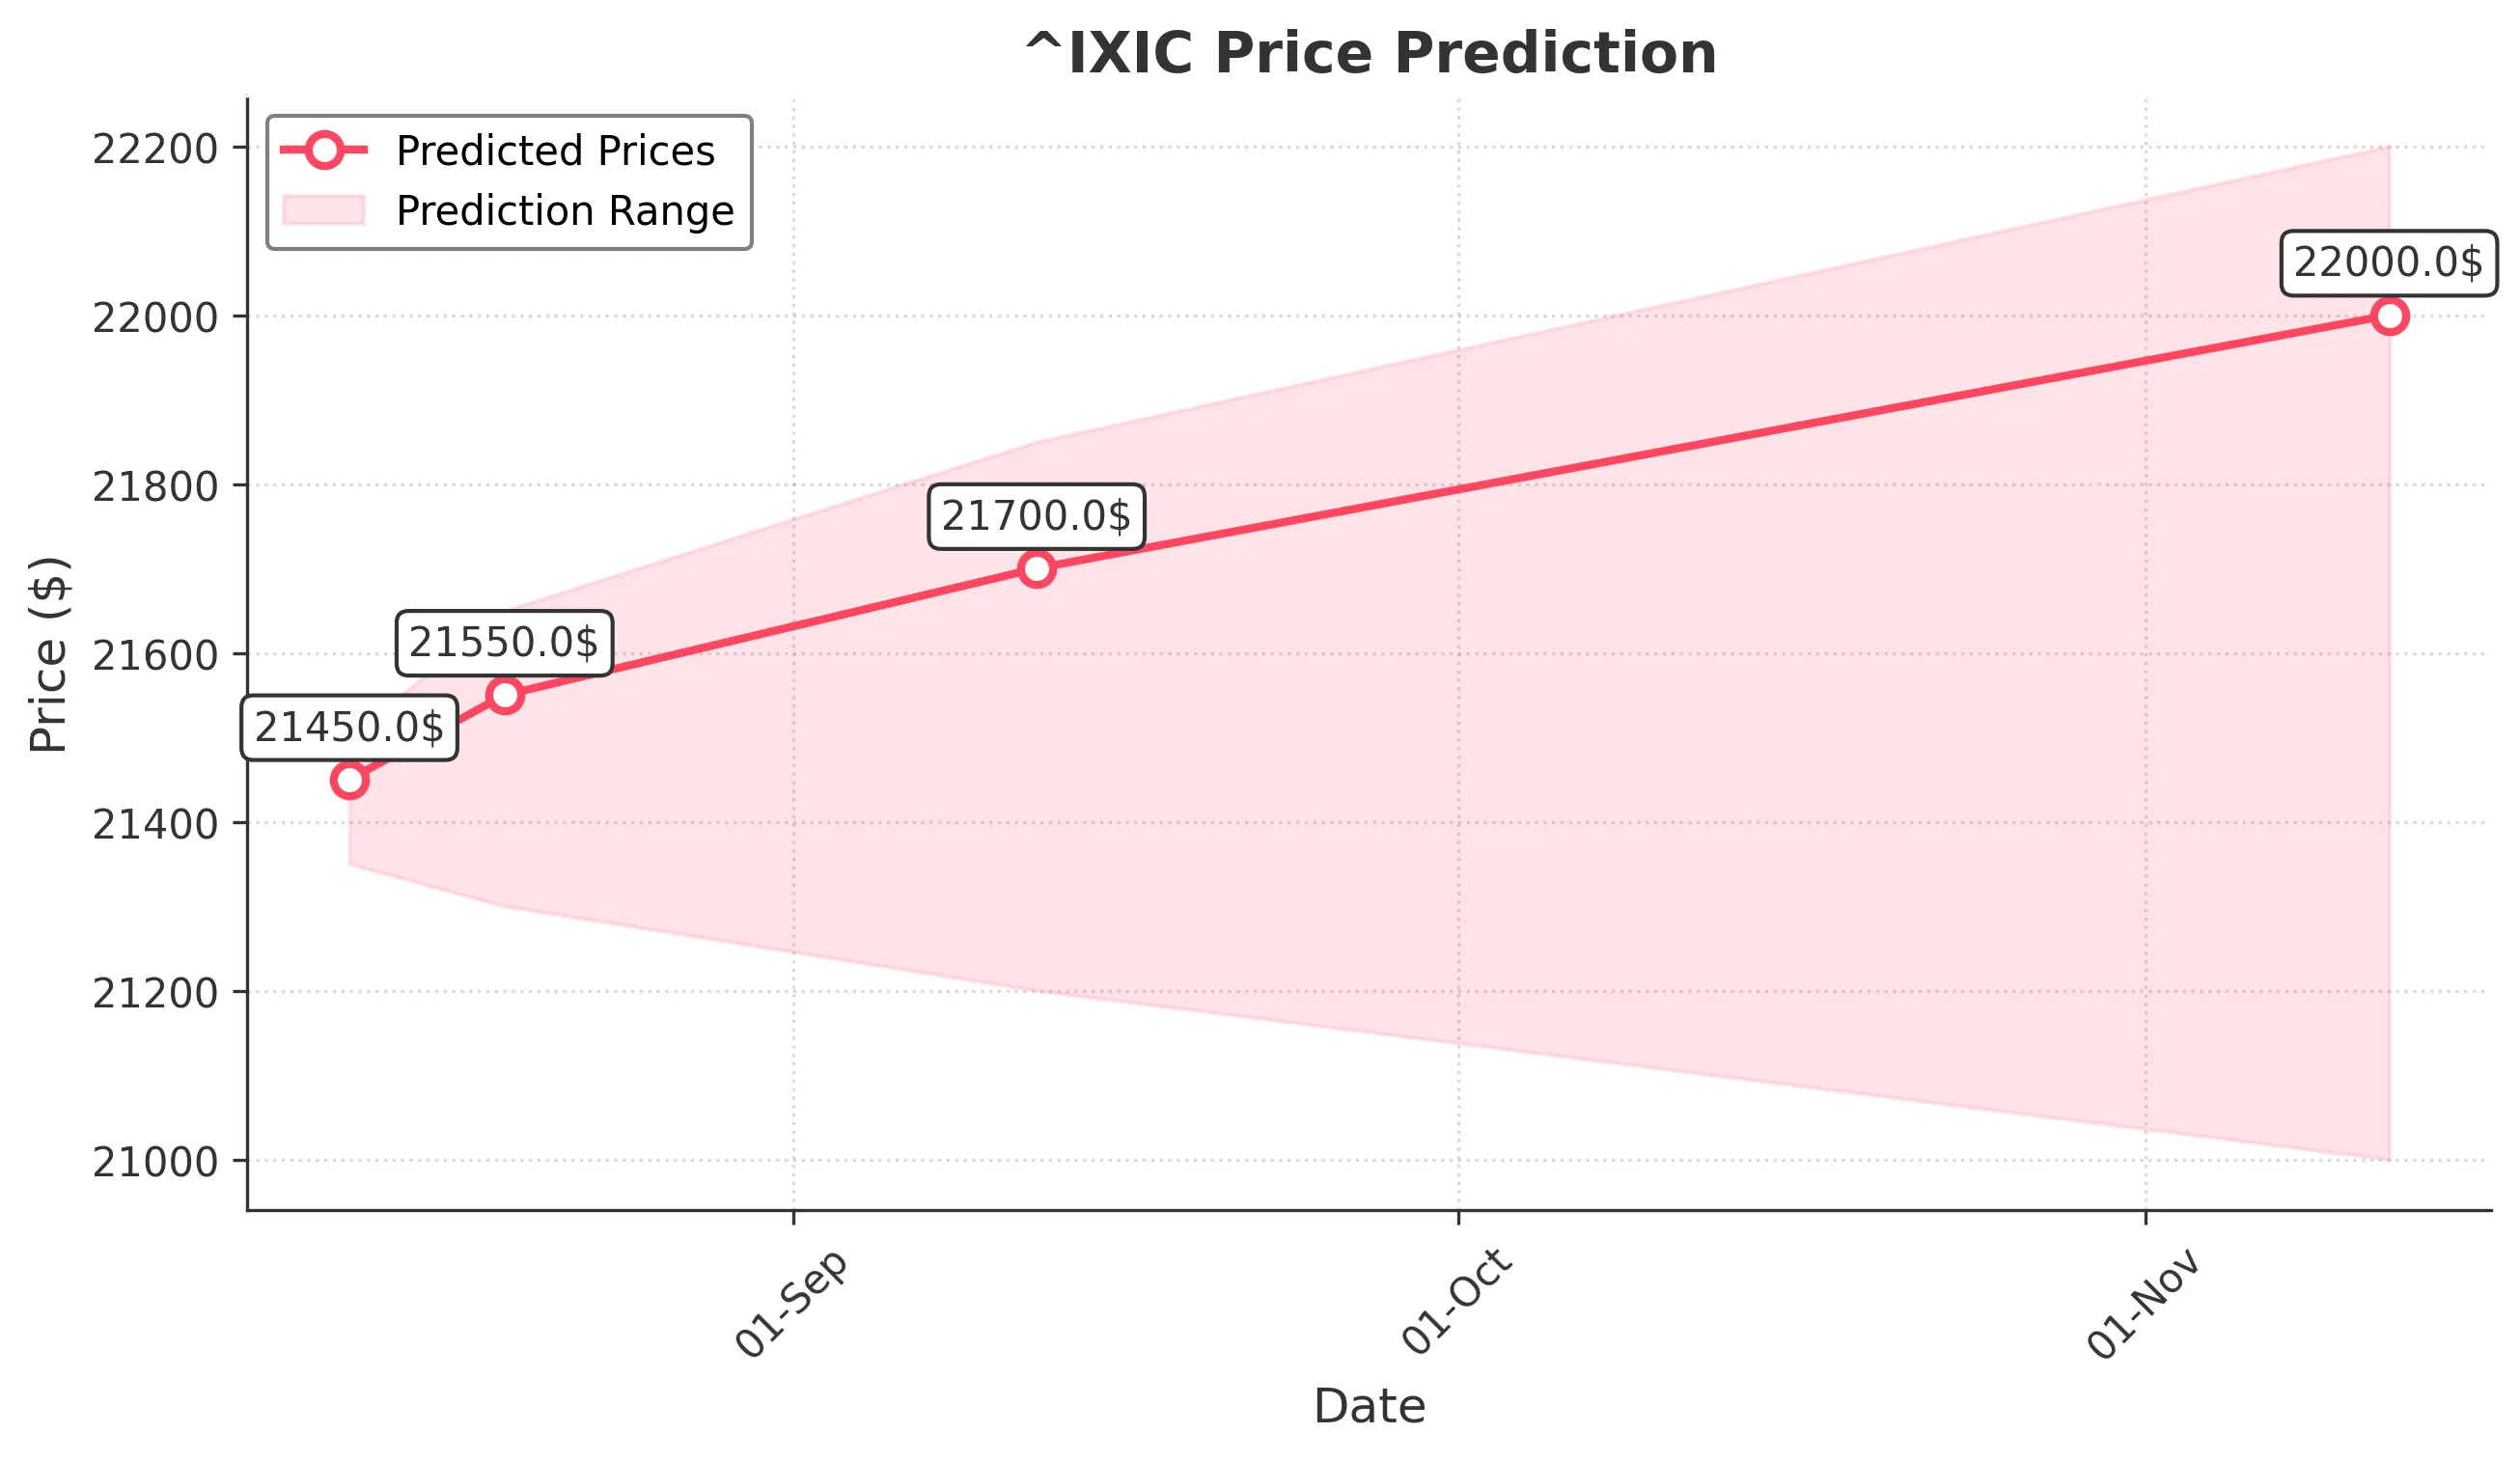
Target: August 12, 2025$21450
$21400
$21500
$21350
Description
The market shows bullish momentum with a recent upward trend. The RSI is nearing overbought levels, indicating potential for a pullback. However, strong support at 21350 suggests limited downside risk. Volume remains healthy, supporting the upward movement.
Analysis
Over the past 3 months, ^IXIC has shown a bullish trend, with significant support at 21000 and resistance around 21500. The MACD indicates upward momentum, while the Bollinger Bands suggest volatility is increasing. Volume spikes on up days indicate strong buying interest.
Confidence Level
Potential Risks
Potential for a reversal if market sentiment shifts or if macroeconomic news impacts investor confidence.
1 Week Prediction
Target: August 19, 2025$21550
$21450
$21650
$21300
Description
The bullish trend is expected to continue, supported by strong earnings reports and positive market sentiment. However, the RSI indicates overbought conditions, which could lead to a short-term pullback. Key support at 21300 will be crucial.
Analysis
The index has been on a steady rise, with key resistance at 21600. The moving averages are aligned bullishly, and the ATR indicates increasing volatility. Recent candlestick patterns show bullish engulfing formations, suggesting continued upward momentum.
Confidence Level
Potential Risks
Market volatility and potential geopolitical events could impact the forecast, leading to unexpected price movements.
1 Month Prediction
Target: September 12, 2025$21700
$21550
$21850
$21200
Description
The index is likely to reach new highs as economic indicators remain strong. However, the RSI suggests a potential correction could occur. The Fibonacci retracement levels indicate support at 21200, which could be tested if the market pulls back.
Analysis
The past three months have shown a clear bullish trend, with significant support at 21000. The MACD is bullish, and the Bollinger Bands indicate potential for further price expansion. Volume trends suggest strong buying interest, but caution is warranted due to overbought conditions.
Confidence Level
Potential Risks
Economic data releases and central bank decisions could introduce volatility, affecting the accuracy of this prediction.
3 Months Prediction
Target: November 12, 2025$22000
$21800
$22200
$21000
Description
Long-term bullish sentiment is expected to prevail, driven by strong corporate earnings and economic recovery. However, potential market corrections could occur, especially if inflation concerns resurface. Key support at 21000 will be critical.
Analysis
The index has shown resilience with a bullish trend, but the potential for corrections exists. Key resistance levels are at 22200, while support at 21000 remains crucial. The overall market sentiment is positive, but external factors could introduce uncertainty.
Confidence Level
Potential Risks
Unforeseen macroeconomic events or shifts in investor sentiment could lead to significant volatility, impacting the forecast.